Bank Nifty using Bollinger Bands and Neo wave
Jan 03, 2023
Like this Article? Share it with your friends!
Bank Nifty has been moving precisely as per Neo wave count. Checkout this example of how we applied ADX and Bollinger Bands along with Price Action to identify the wave counts and predict the price movement.
The following research is picked up from the daily Equity Research Report – The Financial Waves short term update
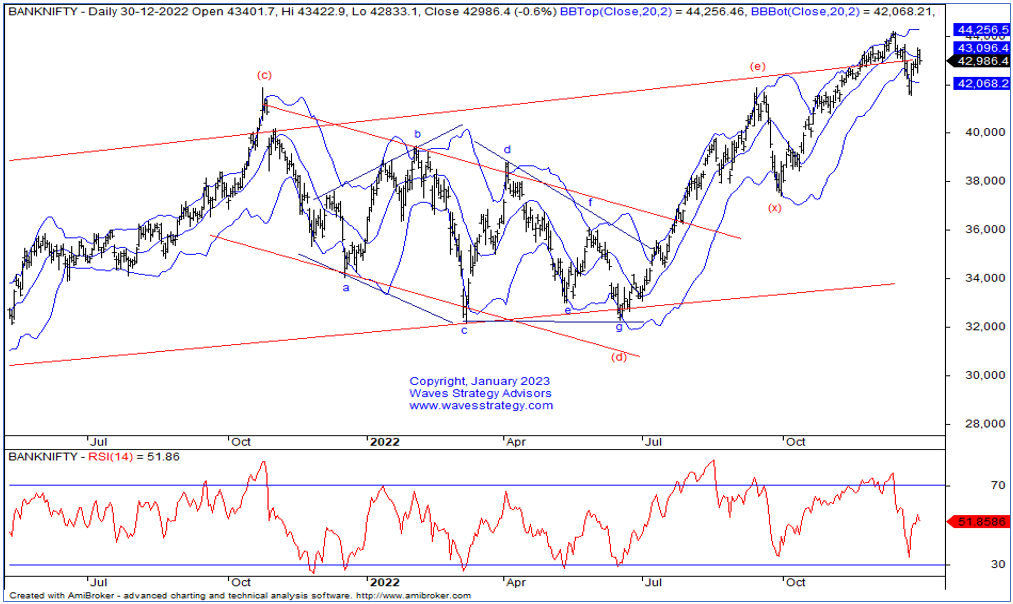
Bank Nifty Daily Chart (As on 2nd January 2023)
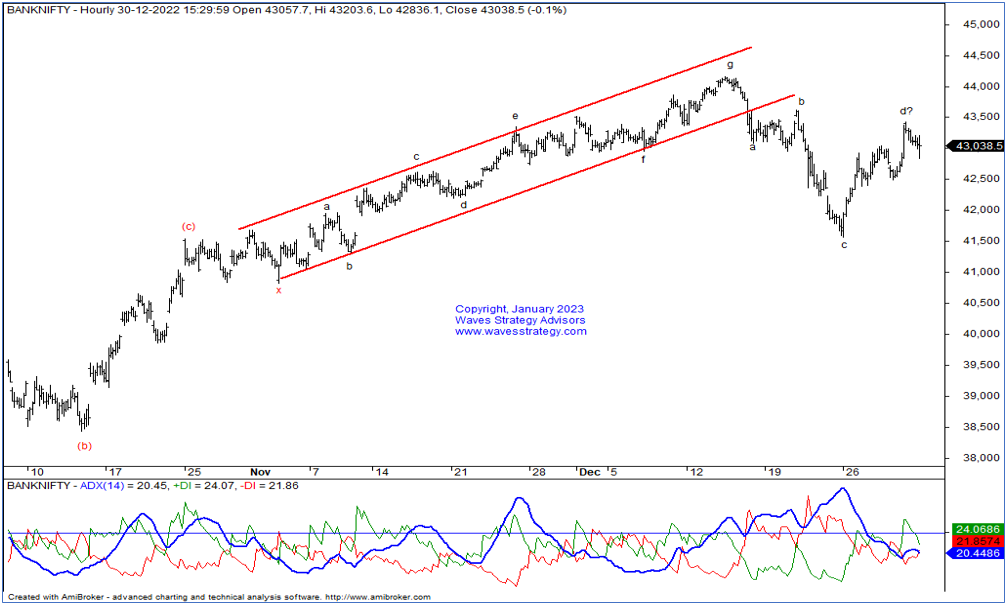
Bank Nifty 60 Mins Chart (As on 2nd January 2023)
Wave analysis as on 2nd January 2023:
In the previous week, Bank Nifty gained nearly 3% from last week’s closing. In the previous session, Bank nifty opened gap up due to positive global cues. Later prices could not sustain higher and since then a good correction was seen which led prices to settle with a loss of -0.61%. As a result, stock formed a big red candle. During the day a high volatility was witnessed. On the daily chart, we have applied Bollinger Bands. Prices are currently hovering near the mid bands which suggest indecision. As per wave perspective, wave (a) is unfolding on the upside.
On the hourly chart, we have shown ADX indicator which gives an indication if it is in a trading range. The low readings of ADX indicates that the stock is in a range. The Adx of indices is 20 giving an indication of lack of trending market. The reading above 25 means strong directional strength.
In short, Bank Nifty is at crucial juncture. Any move above 43200 can lift the price higher towards 43500. Whereas, any move below 42800 can accelerate further selling pressure.
Happened:
As we have mentioned in our report, after breaking the level of 43200, Bank nifty made a high of 43457 which is near our target. Neo wave along with simple indicators helps to form a good trade setup.
Currently, Bank nifty is in a lacklustre fashion. Any move below 42950 can accelerate further selling pressure and then the fall will be in form of wave e which opens the possibility of a Diametric pattern. Whereas, any move above 43500 is needed for fresh buying to emerge.
Be a part of Master of Waves on the 7th and 8th of January which will focus on the Elliott wave, Neo wave, Hurst’s Time cycles, and also a special section on Trading using Gann square of 9. Be a part of this Elite Trading Community #wavetraders. Limited seats. Fill the form here for more details