How to trade KST Indicator with Keltner Channel Breakout on Bank Nifty?
May 30, 2025
Bank Nifty has been experiencing high volatility since the past week. How to catch momentum amid such wild swings?
This setup helps traders to catch the momentum early so that they can fetch maximum gains in minimum time after the signal.
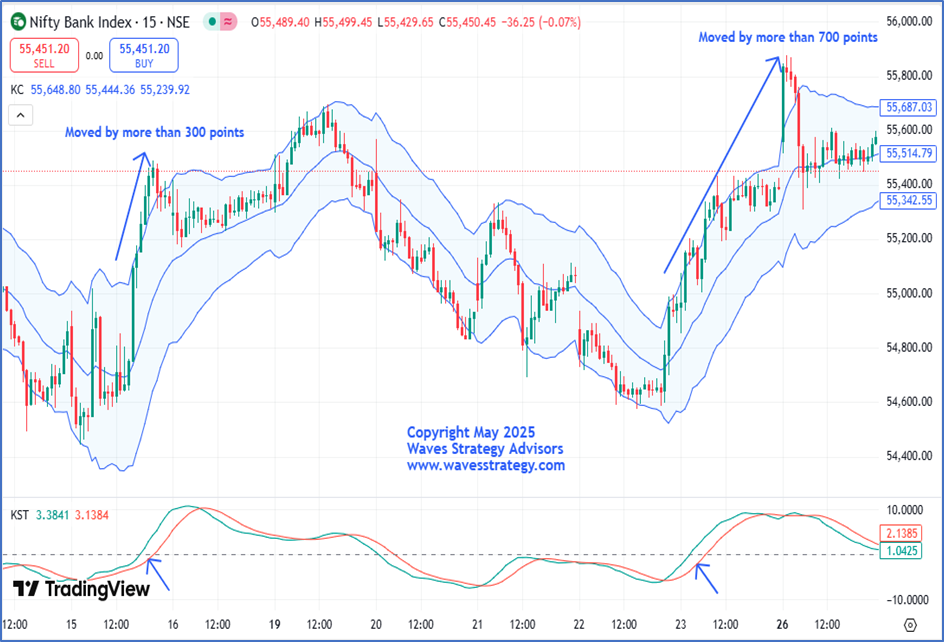
Bank Nifty 15 minutes chart:
 In the above chart of Bank Nifty, we can see two important indicators that are focused on prices and momentum. This strategy usually works on Intraday and even on stocks and Indices.
Keltner channel – This indicator is different than that of Bollinger Bands®. Bollinger Bands uses standard deviation to the mean whereas Keltner channel is derived using Average True Range (ATR). Both of the indicators have different ways of application.
In Keltner channel, we can see on 15th May that prices broke above 55175 levels which was above the upper boundary of the channel and we saw a movement of more than 300 points on a single day. Also, on 23rd May 2025, we witnessed the same breakout and saw a movement of more than 700 on the upside. Along with this, we have applied KST momentum indicator which has worked out wonderfully with the Keltner channel breakout which gives an amazing setup. So, KST momentum indicator broke above 0 line and also the signal line (red line) thereby giving strong confirmation that momentum is picking on upside.
In a nutshell, Keltner channel helps to understand if the size of candle is increasing which is suggesting a significant move and KST further provides confirmation of momentum.
Trishul Membership - Transform the way you trade with the power of Neo Wave forecasting, In-depth training on Ichimoku Cloud, Elliott Wave, Master of Technical Analysis and the 5 Mantras of Options.