Bank Nifty time cycle along with Elliott wave
May 23, 2022
Like this Article? Share it with your friends!
We have combined Time Cycles with the Elliott wave not only to understand the trend but to time the trade as well.
Below is the chart of Bank Nifty along with 89 period Time cycles and prices formed a low precisely near the cycle period as expected and reversed back on the upside.
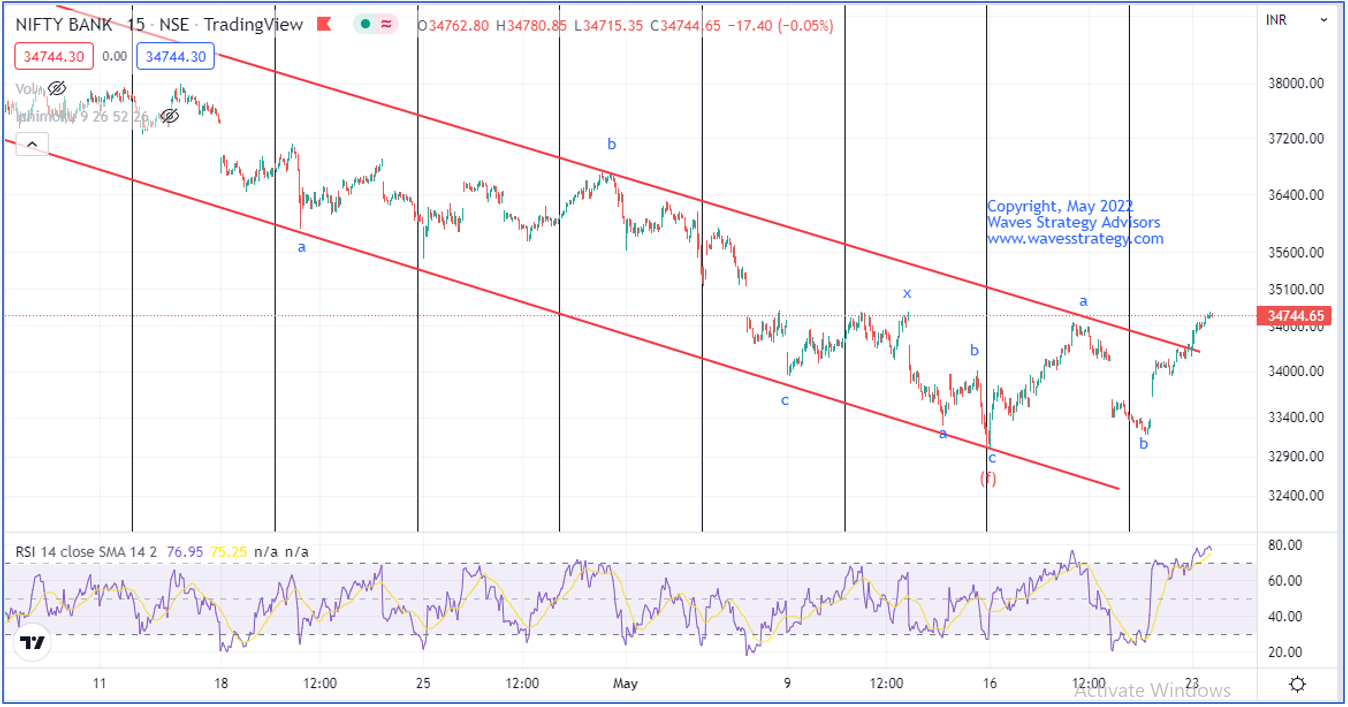
Bank Nifty 15 mins chart:
Elliott wave and Time cycles:
After making the top near 38800 levels, prices tend to move well within the channel in a corrective fashion. Along with that, we have applied 89 Time Cycle which is working extremely well and capturing almost all the lows.
As seen in the 15mins chart, after completing wave (f) (red) near the cycle low, we saw a huge buying in form of wave a. the recent low was wave b unfolding and currently, wave c looks to be moving on the upside. Post its completion we can see a dip again. The near-term resistance is near 34850 levels and crossing it will not be an easy task.
Thus, by combining the Elliott wave pattern and knowing the Time of reversal one can easily understand the trend and can gauge the future direction.
Master of Waves Season 3 - Learn Trade setups for Intraday to Positional on Stocks, Commodity, and Options using Neo wave and Time cycles. This is a simple method provided you understand it from someone who has been practicing it for years. Be a part of the Elite Traders community #TimeTraders and time the market like a pro. 2 days of Live event on 28th – 29th May 2022, Limited seats only, register now over here