Bank Nifty 54 Days’ Time Cycle - Must See!
Jan 19, 2023
Like this Article? Share it with your friends!
Time Cycles are powerful studies that can give reversal areas and this if combined with price action can give amazing trade setups with higher accuracy.
Below is the chart of Bank nifty index along with 54 Days Trading Time cycle.
Bank Nifty 54 Period Time Cycles on the Daily chart
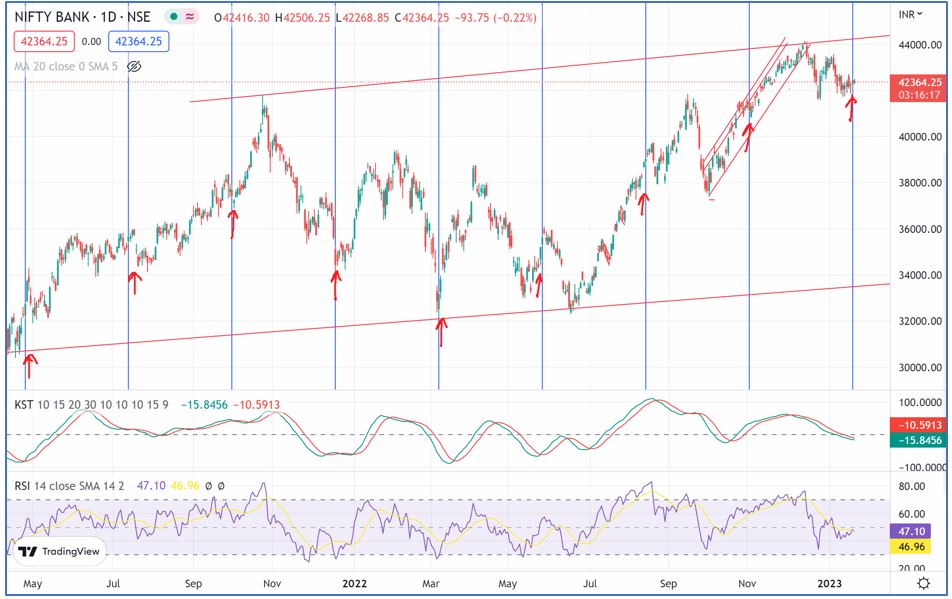
Time Cycle analysis: The best way to enter the trend is on the basis of Time cycles. Cycles are essentially used to capture lows. In the above chart as well, we can see most of the lows are formed on our cycle and after every 54 period, Bank Nifty has shown a positive reversal. If prices confirm along with Time it can give best conviction for traders.
Yesterday’s low was also formed exactly on our cycle near 42119 levels. As of now, any move above 42720 will turn time on the positive side but price action is must to confirm the same.
Same concept of Time can be applied to various time frames like 15 minutes time frame and even 5 minutes time frame which can help traders to time the market.
Mentorship on Timing the Market – To create the passive source of Income, achieve financial freedom and trade with an edge with consistency by leveraging options learn the science of Time which will be the focus for Mentorship March 2023, Fill the form below for more details: