BEML – Using Time cycles with wave theory
Oct 11, 2021
Like this Article? Share it with your friends!
Advance techniques like wave theory and Time cycles can help in identifying trade setups where prices move in with strong momentum in a short time after entering the trade.
Check out the research below where we combined Time cycles and Wave theory to pick a stock for our Momentum calls and research subscribers on 6th October 2021
BEML daily chart:

BEML hourly chart:
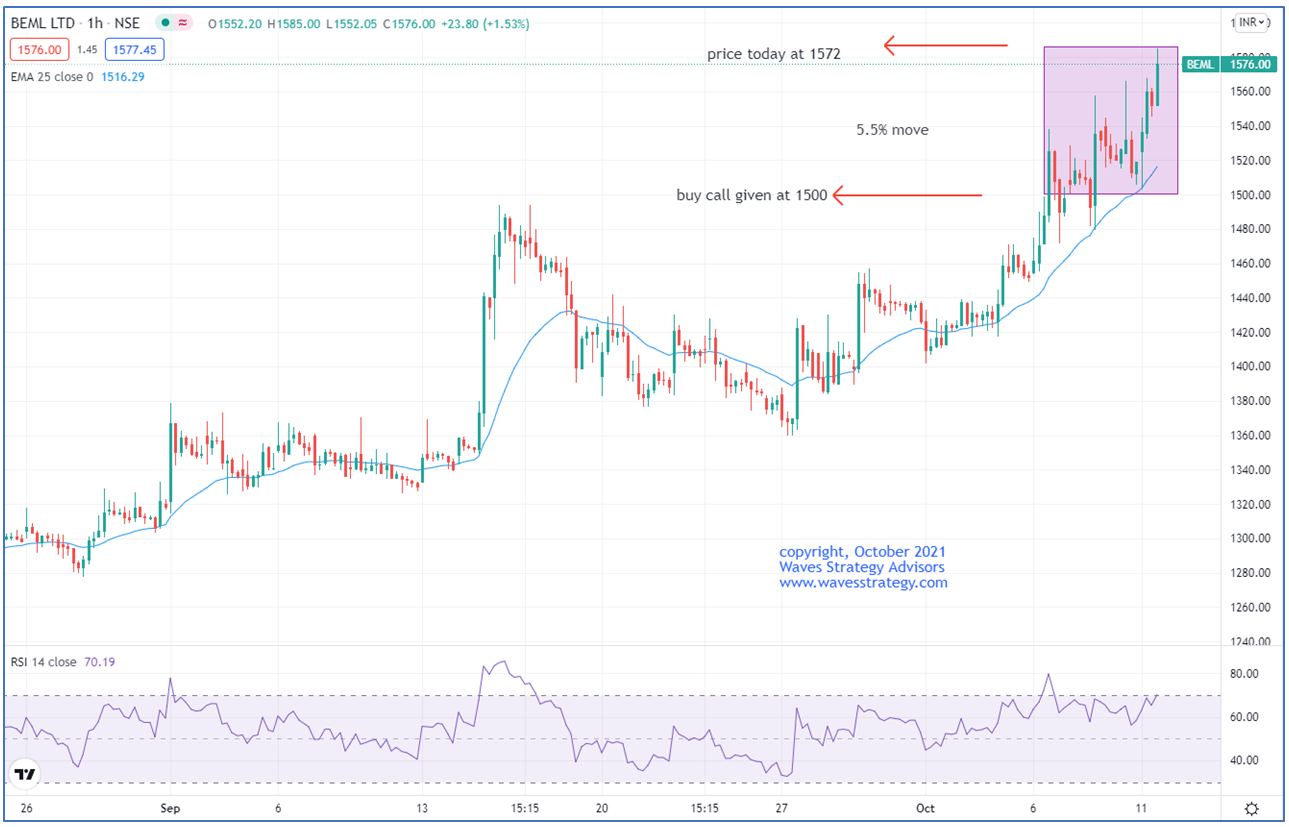
Analysis:
BEML is in a strong impulse rise as we can see in the daily chart. Price is moving in the form of intermediate degree wave 3 within which minor degree wave iii was unfolding. The third wave of an impulse is often the largest wave in terms of price movement hence riding this wave is most profitable.
We have also plotted the 131 days’ time cycle of the daily chart wherein important lows can be seen forming. After the formation of the most recent cycle low price formed a swing high near 1500 levels and we gave a buy call on the stock as it broke this level again which confirmed our bullish bias both as per time cycle and wave theory.
Happened: The stock managed to gain 5.5% within less than a week after we gave the call and is still running for higher level targets.
Get access to Momentum calls and research consisting of applications on charts and how you can ride the trend using simple powerful Wave theory. Subscribe here
Mentorship on Timing the Markets for the FIRST TIME EVER starts November 2021 – In this Mentorship program, all the necessary tools are given right from stock selection methods, strategy, follow-up action to derive a complete trade setup in step by step fashion. To know more fill the form below: