
BEML: Gann Analysis Predicted the Rally — What Could Come Next?
Sep 03, 2026
When we combine simple price action with Gann square of 9 and Time Cycle, it helps to form powerful setups with accuracy. Price tells us where the market is headed, but Time tells us when the move is likely to unfold. Time Cycles also helps traders to anticipate high-probability market turning points.
Check out the research below on BEML, we had covered this stock previously in our Vayu dated on 19th August 2026.
BEML Ltd Daily chart Anticipated as on 19th August 2026
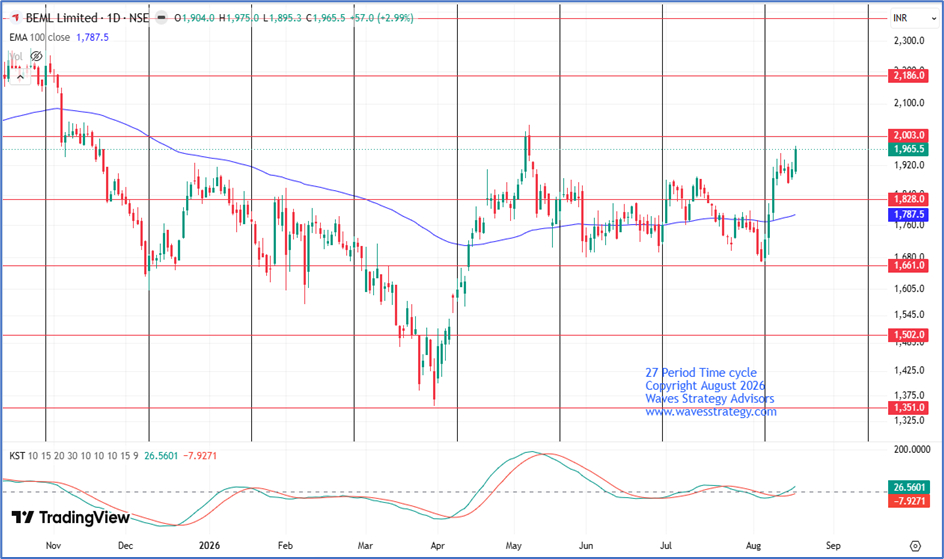
Anticipated as on 19th August 2026
On the daily chart, BEML has been moving up especially since 06th August 2026 prices have seen substantial rise of more than 15% indicating strong buying pressure in the stock. In the previous session, the stock has broken above the minor prior swing high of 1955 and is now heading higher resuming its prevailing prior trend. Also, KST indicator has given a crossover with KST line (Green) currently trading above the 0 line indicating that the bullish momentum is developing in the stock.
27 Period Time cycle - The stock is currently following a 27-period Time cycle. The latest cycle was on 6th August 2026 where prices made a low near the 1686 level and has already risen by more than 15% on the upside.
Gann square of 9: The horizontal lines on the above the chart are Gann levels which help to identify support and resistance level especially in stocks which have been trading in a sideways manner. Here it can be observed that post breaking out of the 1828 Gann level prices are currently approaching the next Gann level of 2003. A further break above the same can push prices higher towards next Gann level of 2186.
In a nutshell, the trend for BEML is on the upside as indicated by multiple studies. For now, any break above the 1965 level can attract further momentum resulting into prices potentially reaching towards its prior swing high near 2037 followed by 2170 with key support being around the 1880 level.
Key resistance – 2186
Key support – 1880
Trading strategy: Long positions can be initiated once the stock breaks above the 1975 level with stoploss as 1890 and target of 2090 (One can book part tp near 2025 – 2040 and trail sl to cost)
BEML Ltd Daily chart Happened as on 03rd September 2026
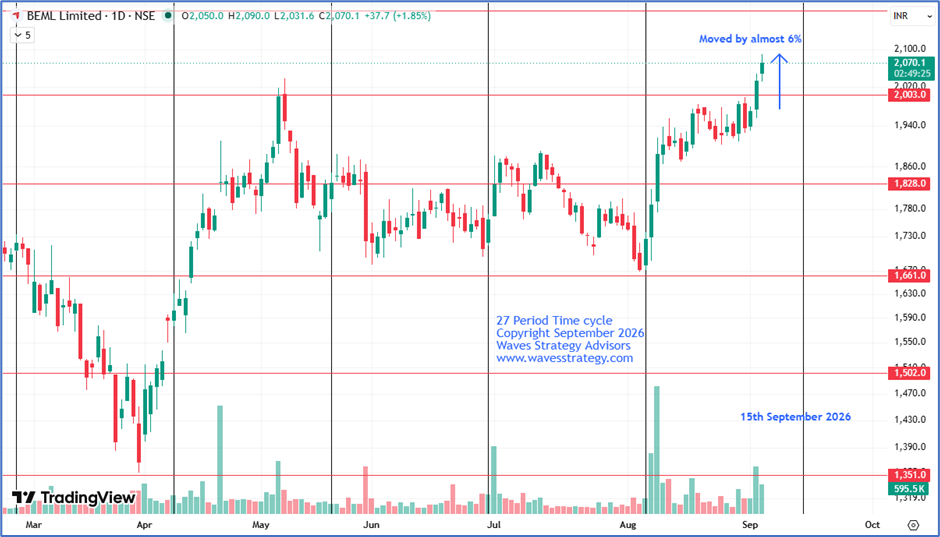
Happened as on 03rd September 2026
- Post breaking out of the 1975 levels BEML managed to surge by almost 6% in just two weeks achieving our target of 2090.
- The next cycle date to keep an eye on is 15th September 2026.
Conclusion
- The combination of Gann square of 9 and Time Cycle confirmation suggest a strong technical setup.
- For now, traders should avoid catching tops and prefer using dips as an opportunity to ride the ongoing trend as long as 2003 (Gann support) holds on the downside.
Brahmastra (Mentorship) on timing the market using Hurst’s Time cycles along with Elliott wave, Neo wave, complete handholding & stock selection algo creation with access to traders community. A mentor can change the learning curve that can take years to a few months. Act now, Know More
If you want to go beyond individual market forecasts and learn a systematic approach to analysing stocks and options, our Trishul Membership combines multiple technical-analysis techniques into one framework.
The program covers:
- Keltner Channel + KST applied directly to options charts
- Neo Wave for understanding market structure and forecasting
- Ichimoku Cloud for trend and momentum analysis
- Practical methods for analysing stocks and options
Trishul Membership — 3 Months
Limited seats are available.
Fill in the form below for more details.