Biocon Here is the Proof of Impulse
Jun 02, 2020Biocon has continued to outperform in pharma sector and moved in upward direction precisely as per Elliott wave counts and simple channelling technique.
In our Free Webinar conducted on 23rd May 2020 and 30th May 2020 explaining Trade Setup using Elliott wave, we had discussed the overall outlook for this stock and plotted the counts as shown below in the chart. If you would like to attend the free webinar by Ashish Kyal Trading Gurukul scheduled on 6th June 2020 register here.
I will be discussing more such stocks.
Biocon Daily Chart: (shown on 23rd May during the Webinar)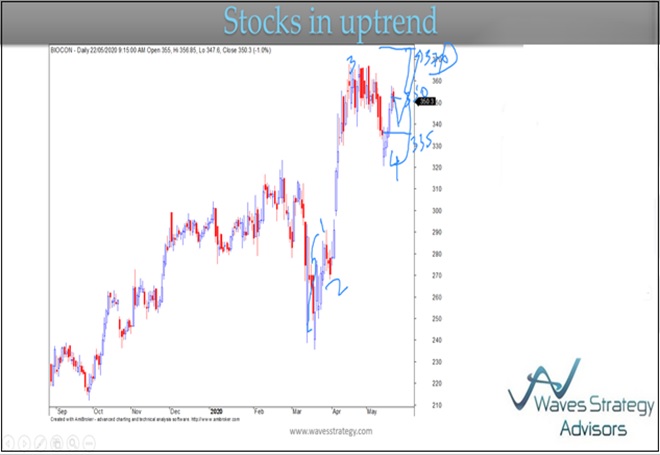
Biocon Daily Chart: Happened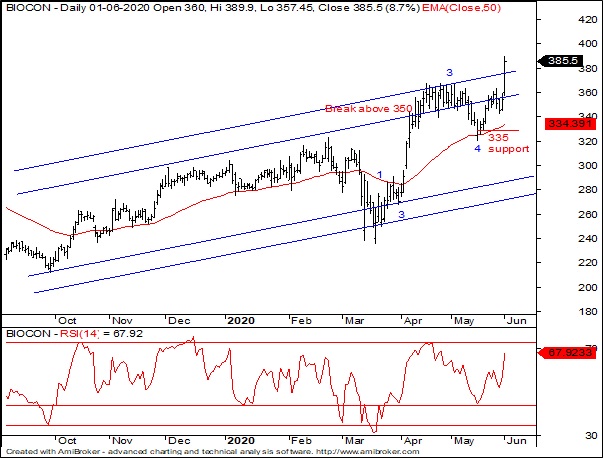
Elliott wave Analysis: As per our discussion in our session on 23rd May and later again on 30th of May in How Trade using Elliott wave, we discussed that Biocon has completed wave 4 and wave 5 should come on the upside which was shown on daily chart during the presentation. This is what has happened you can clearly see Biocon has gained up to 8 %in yesterday’s session and it has moved precisely as Elliott wave pattern and the trade setup which was discussed in the webinar.
In today’s session the up move continued and the stock managed to make its new 52 week high near 396 levels. This shows that pharma sector is now moving in-line with the index as earlier it moved with inverse relation. Biocon has been precisely moving in upward direction as guided as per wave counts
Further if you want to know to how to trade stocks like this subscribe to our Momentum services.
Mentorship – Learn to identify such momentums stocks and trade in disciplined fashion. It is not often you find such huge swings on either side and with the necessary technical analysis methods you can ride the trend in either direction. 3 months of Mentorship starting 20th June, will give a complete handholding. Only few more days before the registration closes. Know more here