Bollinger Bands® Breakout Strategy
Jul 22, 2021
We have shown how a pattern like rounding bottom can be used along with Bollinger Bands that can be help identify breakout stocks. Salona possibly an unknown name to many but showed very good breakout post it was published in daily research report.
We published the following research on SALONA pre market on 14th July in “The Financial Waves Short Term Update”
SALONA Daily chart as of 13th July 2021

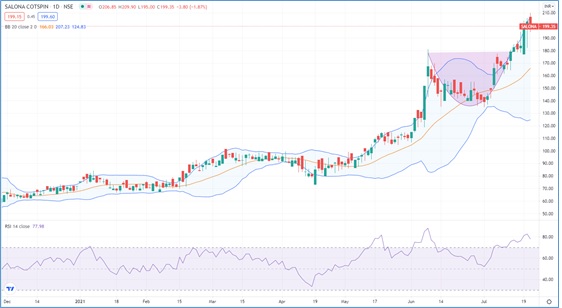
SALONA Daily chart as of 22th July 2021 (happened)
Wave Analysis: (as published on 13th July 2021)
Anticipated: “In the month of April 2020, along with the broader markets, many small cap and midcap stocks formed crucial lows and since then it has been intact in uptrend. SALONA is intact in strong uptrend…
On the daily chart, in the previous session the stock formed a strong bullish candle and now it is on verge of taking out the previous highs of 181 levels. Prior to this, stock witnessed some retracement towards 135 levels and post that bulls have taken the control. Prices have given close above the upper Bollinger band which suggest a strong bullish trend is intact and we can expect upside momentum to continue from hereon.
In short, trend for this stock is positive. A break above 181 can lift prices higher towards 195-196 levels as long as 165 holds on the downside” BANG ON!
HAPPENED:
The stock broke above 181 levels and made a high near 210 levels which is a gain of 16% within few days!
Subscribe to the Daily equity research report – The Financial Waves Short Term Update and get insight into Nifty, Bank Nifty, Stocks that are providing good opportunity and much more. Get access now to be on right side of the trend over here
Learn these techniques of Trading using CandleStick, Bollinger Bands, Volume Profile and much more in upcoming Master of Technical Analysis (MOTA Season 2.2) Time is running out as Early Bird Ends soon! Know More Here