
BPCL Ready for Breakout? Here’s What Time Cycle & KST Indicator Suggest
May 29, 2026
For a cycle practitioner the most important aspect is to understand that there are multiple cycles nested together. Prices behave in a cyclical fashion and cannot be independent to it. Everything in nature and financial markets is governed by cycles right from the Solar Cycle which is 11 years, Lunar cycle of 28 days, Seasonal cycle, Economic Kondratieff cycle of 54 years, Decennial cycle 10 years, Presidential cycle of 4 years and many more.
It is our effort to understand the various cycle currently being active on the given asset class and see where we stand with respect to them.
The simplest way of cycle identification is to see if there are low being formed in systematic fashion. There are various tools available to detrend the prices and understand the underlying cyclicality. J. M. Hurst’s has brought forward Hurst’s Cycle analysis which has opened up another realm of looking at markets and timing it right from the smallest time frame to the biggest degree.
We are not getting into the science of cyclicality but will show the application of these cycles after careful evaluation and synchronization. Let us begin by looking at the bigger degree cycles first.
Check the research below on BPCL combined with Time cycle and KST indicator
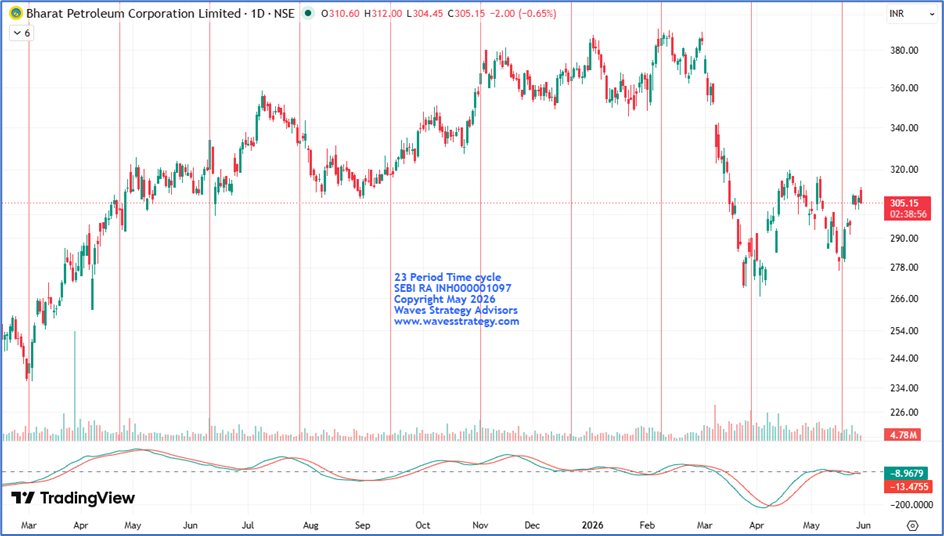
Analysis on BPCL
- The stock has been following a 23 Period Time cycle consistently making temporary lows and bouncing back on the upside.
- The most recent cycle was on 19th May 2026 and the stock has reversed by more than 10% since then signalling a major importance in catching the bottom.
- However, one thing to keep in mind before initiating a position is to notice where the current price is in alignment with the cycle. One basic rule is that long positions should only be initiated when the price breaks above the prior swing high and short positions should only be initiated once the price breaks below the prior swing low.
- It can also be observed that the stock has formed a double bottom pattern which is a bullish reversal pattern
- Combine this with KST indicator and Time cycle it can help catch a trader momentum which is usually favoured among the
In Nutshell, For now, any break above the prior swing high of 320.3 with KST line crossing the signal line followed by 0 line will bring forth a momentum burst towards 335- 340 as long as 276 remains protected on the downside.
Brahmastra Mentorship – Advanced Market Timing
Time the market to the very day, hour, and minute using a powerful combination of:
- Elliott Wave & NeoWave
- Hearst Time Cycle Analysis
- Stock Selection Algorithm
- Practical Risk & Money Management
Brahmastra – 3-Month Mentorship Program
- Learn structured market timing techniques
Fill the form below to know more