BPCL Path Ahead with Elliott Wave – Crucial Breakout Levels to Watch!
Sep 30, 2025
Elliott wave is GPS of the market that shows probable path that prices can follow. It also provides strong forecasting ability right from short to long term forecasting.
New traders want to trade and capture every moves & on other hand seasoned ones know the real money lies in sitting tight and try to capture the best of the impulse waves.
Read the full research report on Bharat Petroleum Corporation Ltd below:
BPCL Daily Chart with Elliott Wave as on 30th September 2025:
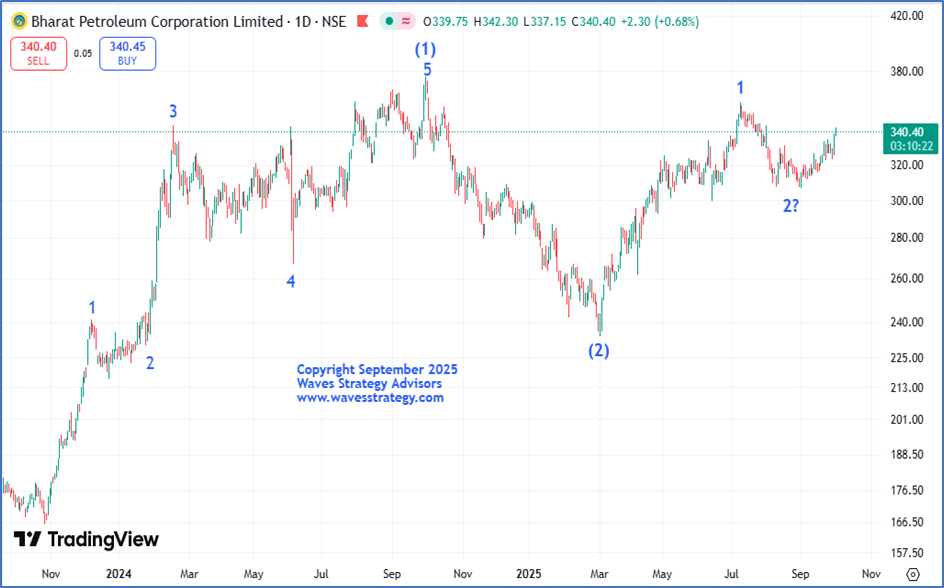 BPCL has been moving as per classic Elliott wave theory. The rally that started from the month of October 2023 has been unfolding in the form of wave (1) of Primary wave which lasted nearly a year. Post which, the entire correction has been in the form of Primary wave (2) which got completed in February 2025. Post which the rise has been ongoing in the form of Primary wave (3) which is further subdividing in nature. In which, a break above 345 levels can suggest completion of internal wave 2 on the downside, following it the rise will be in the form of internal wave 3 of (3) which is considered the strongest terminus.
In a nutshell, we can conclude by saying that when Price and Elliott wave are in sync it can lead to interesting results even in stocks. On the downside, 305 is the crucial support. As long as price respects the same upside momentum is likely to continue once we see a break above 345 levels.
Brahmastra (Mentorship on Timing the market) – Over period of 3 months equip yourself with all the tools to trade the market with an edge of Time cycles, Elliott wave, Neo wave concepts that can be used across all markets, Options strategy, access to a private community group, stock selection scanner, Multibagger and Momentum stock identification technique, Mentorship sessions for the complete trading journey. Fill the form below for more details: