CHENNPETRO at a Possible Breakout? Time Cycle May Trigger the Next Rally
Mar 05, 2026
Price Action tells us the direction, but Time Cycles reveal the timing.
Time Cycles are a powerful yet simple concept that help identify potential market turning points. When combined with strong Price Action confirmation, they create clearer, high-probability trading opportunities with improved risk-reward.
Below is our detailed research and analysis on Chennai Petroleum Corporation Ltd
CHENNPETRO Weekly chart with Time cycle and AK indicator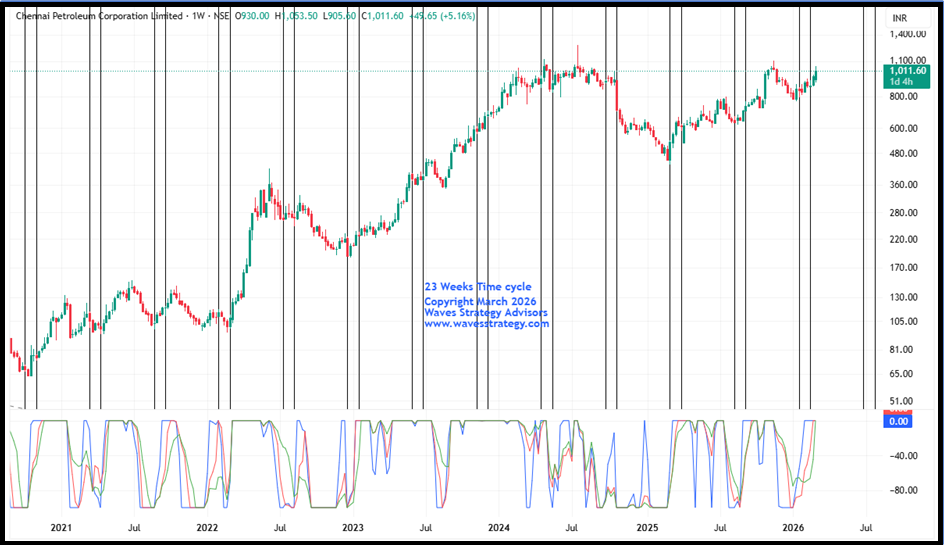
23-Period Time Cycle (Weekly):
- The 23-period Time Cycle has shown strong consistency on the weekly timeframe.
- Historically, whenever prices approach this cycle zone, the stock has witnessed a meaningful upside reaction.
- These turning points highlight the reliability of Time Cycles in identifying potential lows and early trend reversals.
- The next cycle window is expected around 29th June 2026.
Price Action Trigger:
- The recent low was made near the cycle zone of level 5 and since then the stock has rallied by more than 37% indicating the significance of it.
- The prior swing high of 1103 acts as an important resistance level.
- A decisive breakout above 1103 would indicate that the cycle has likely turned on the buy side.
- Such a move could strengthen bullish momentum and open the door for further upside.
AK Indicator – Momentum Signal:
- The AK Indicator is a custom-built tool used to assess trend direction, momentum, and potential reversals.
- Currently, all three lines of the indicator are turning upward toward the zero line.
- This suggests improving momentum and the early stages of a fresh bullish phase.
Confluence of Time & Price:
- When Time Cycle analysis aligns with Price Action, it creates a strong analytical framework.
- This combination helps traders identify potential reversals early.
- It also improves timing accuracy and allows traders to participate with better risk-reward while filtering market noise.
Overall Outlook:
- Chennai Petroleum Corporation Ltd continues to maintain a positive bias.
- A sustained move above 1103 could push prices toward the all-time high of 1275, followed by 1400.
- On the downside, 900 can act as a near term support level.
3 Months of #Brahmastra Mentorship Program: Timing the Markets
A limited-seat mentorship program focused on:
- Basics to advanced technical analysis
- Elliott Wave & Neo Wave
- Time cycles
- Stock selection algorithms
- Complete understanding of chart patterns
- Exclusive mentorship sessions
- Simple, practical trade setups that actually work
Fill below form for more details