Coal India Elliott Wave Analysis: Trend Still Intact?
Apr 30, 2026
Elliott wave analysis, when combined with basic price action studies, helps create high-probability trade setups with greater accuracy by aligning price structure with timing, allowing traders to identify stronger entries, better risk control, and more reliable market reversals.
Check out the below research on Coal India--
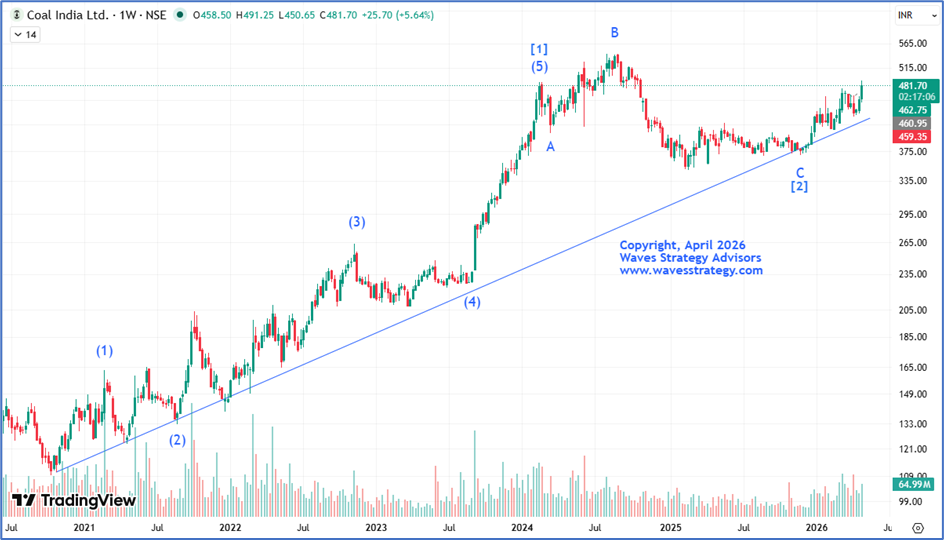
COALINDIA Weekly chart as on 30-04-2026
Analysis -
- The stock has been in a strong uptrend since late 2020, consistently forming higher highs and higher lows, which reflects sustained bullish momentum despite intermittent corrections.
- Prices have broken above the minor prior swing high of 475 level and is now heading higher.
- Additionally, the stock continues to respect its multi-year upward sloping trendline. Each time it approaches this trendline, it finds support and rebounds, highlighting consistent accumulation at lower levels.
- The most recent support was observed near the 380 mark around 8th December 2025, after which the stock has witnessed a steady upward move, reaffirming the validity of this trendline.
Wave perspective:
- From an Elliott Wave standpoint, the stock completed its Intermediate Wave (5) on 12th February 2024 and also marked an end to wave [1] by forming a new high. This was followed by a corrective phase identified as Wave A of wave [2].
- Subsequently, the stock surged to a new all-time high of 543.55, which appears to be an exhaustion move driven by strong buying interest and is labelled as Wave B of wave [2].
- Recently wave C got completed near the trendline support and also marked an end to wave [2] and now fresh leg is expected to begin on the upside in the form of wave [3].
In Nutshell
- The broader structure of Coal India remains bullish, with intermittent corrections acting as healthy pullbacks that offer opportunities for traders to participate in the ongoing trend.
- For now, one can use dips as an opportunity to ride the ongoing
Brahmastra (Mentorship on Timing the market)
Learn to time the market to the very Day, Hour and Minute by combining the concepts of Hurst’s Time cycle on Index and stocks as well, Gann square of 9, Elliott wave, Neo wave and be a part of elite trader’s community who are Time Traders.
Fill the form now
3 Months of TRISHUL Membership (Options Mantra + Elliott Wave + Neo Wave)
Trishul Membership – Options Trading with Elliott wave, Neo wave, Ichimoku cloud, and sacred science of trading & forecasting is covered in the Options Mantra Live Sessions - 11th - 12th April & Sutra of Waves Live Session - 9th - 10th May 2026. Limited seats available.