Coal India - How to identify the trend using wave theory
May 11, 2022
Like this Article? Share it with your friends!
Elliott wave help us to navigate the trend of the market. Coal India has continued to be showing weakness over past few sessions. It has worked out well especially if you know how to apply Elliott wave along with technical indicator.
Look at the below chart of Coal India published in the Equity research report on 09th May morning before markets opened – "The Financial Waves short term update"
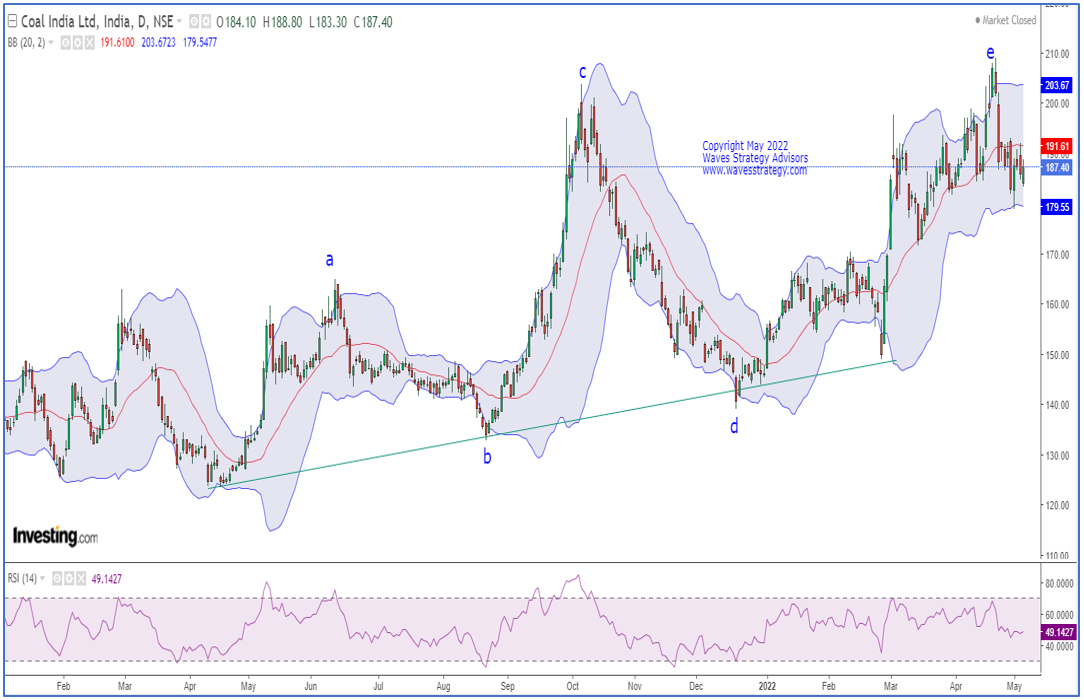
Coal India Daily chart as on 09th May 2022: (Anticipated)
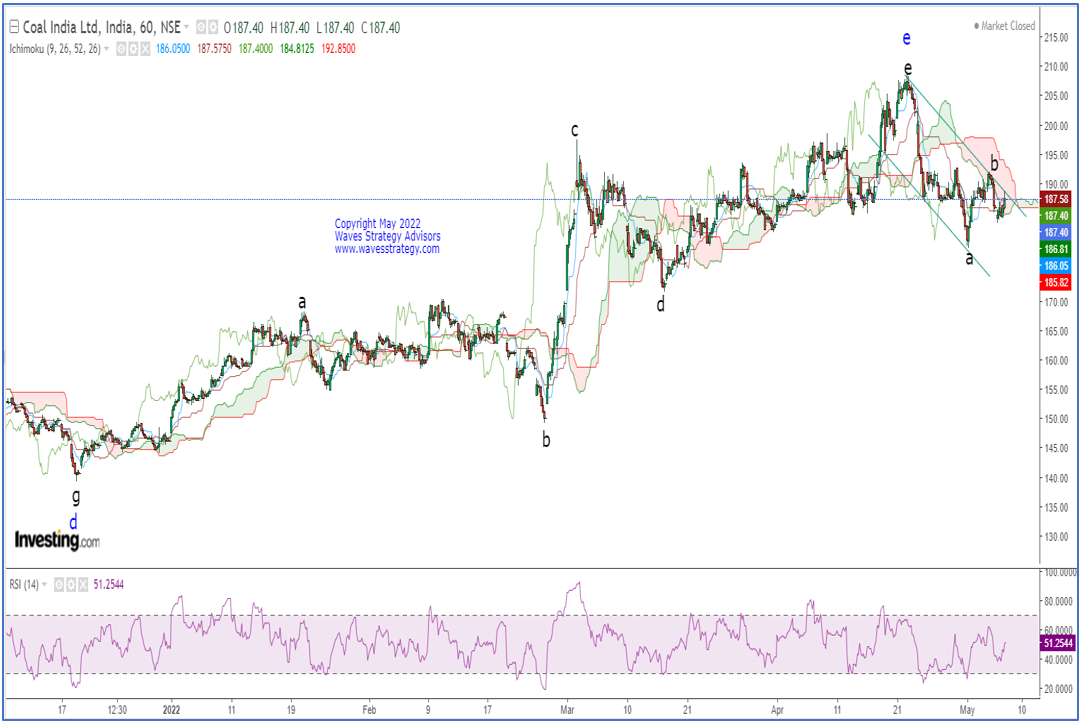
Coal India 60 mins chart as on 09th May 2022: (Anticipated)
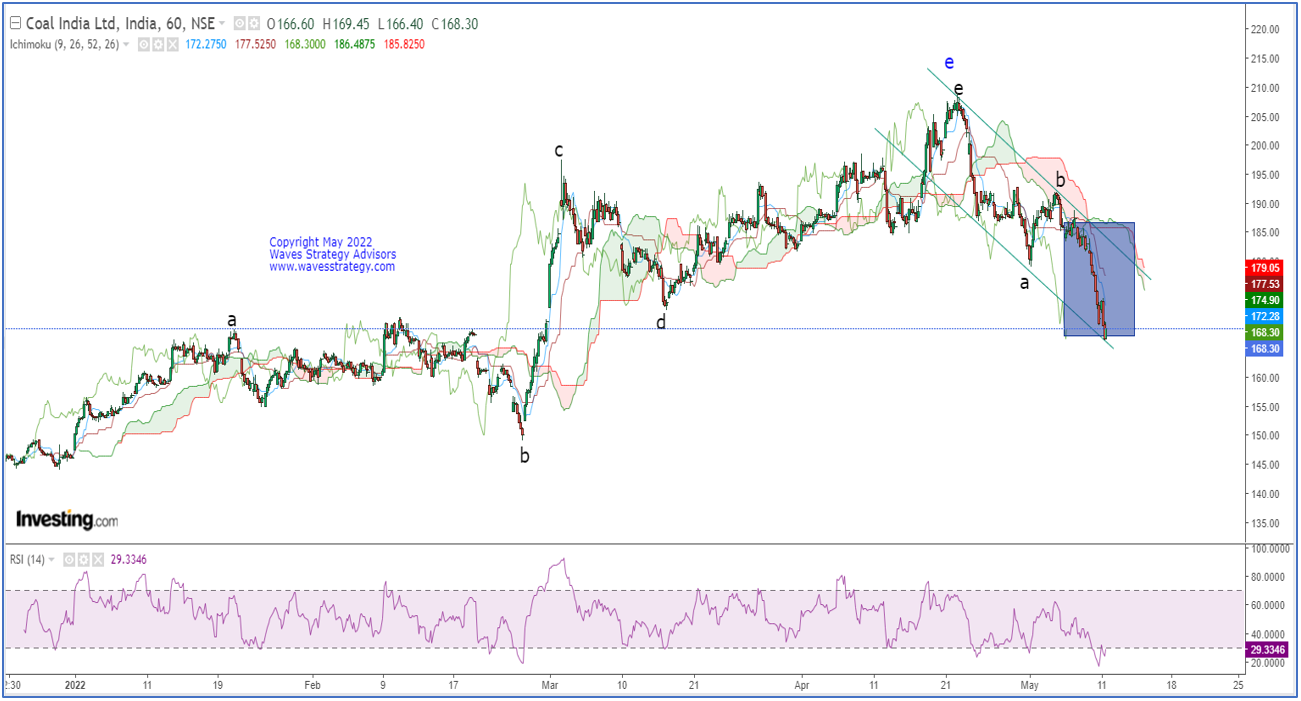
Coal India Happened (11th May 2022)
Waves Analysis as on 09th May 2022:
On the daily chart, we have applied Bollinger bands to gauge the price range. The prices are trading towards the lower bands of the Bollinger bands in which mid bands is acting as a resistance to the price. This suggest that the bias will remain bearish as long as we do not see a daily close above the mid bands. As per wave perspective, wave f is unfolding on the downside.
As shown on the hourly chart, prices have reversed from the ichimoku cloud which suggest that the overall bias is still intact on the downside. Currently, wave b might have completed on the upside and another leg has started in form of wave c.
In short, trend of Coal India looks sideways to bearish. Any move below 183 levels can take the price lower towards 179-178 levels as long as 187.30 levels holds on the upside.
Happened:
We can see that wave count have helped us to find out the trend reversal of Coal India well in advance. Given the fall forming the high around 209 levels, there is a possibility that wave f has started moving on the downside. As per the internal count, wave c is unfolding on the downside. However, any move above 175 levels will provide us further indication that wave c has completed its course and a short-term pullback can be seen in form of wave d towards 180-181 levels. Within the two-trading session, COALINDIA has fall nearly 9% from the above-mentioned levels. This early move can be easily identified using wave theory.
Master of Waves Season 3 - Learn Trade setups for Intraday to Positional on Stocks, Commodity, Options using Neo wave and Time cycles. This is simple method provided you understand it from someone who has been practicing it for years. Be a part of the Elite Traders community #TimeTraders and time the market like a pro. 2 days of Live event on 28th – 29th May 2022, Limited seats only, register now over here