Copper moved as expected in line of wave counts, BB, Moving average suggested. !
Feb 15, 2021
Copper has seen rise towards 549 levels on 23rd October 2020 the metal moved as expected in line of wave counts suggested.
Below is the chart we published in our monthly report, “The Financial Waves Monthly Update”
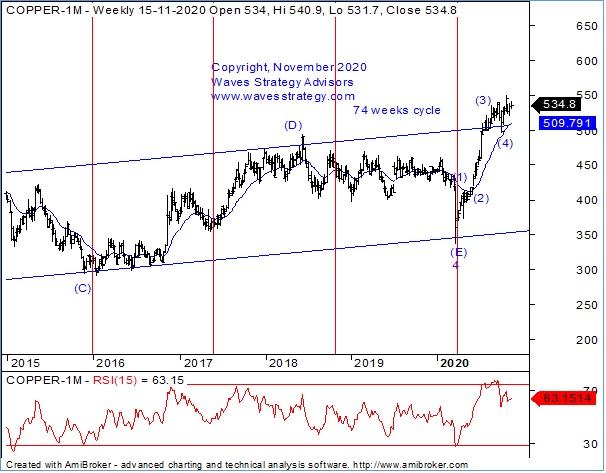
Copper weekly chart:
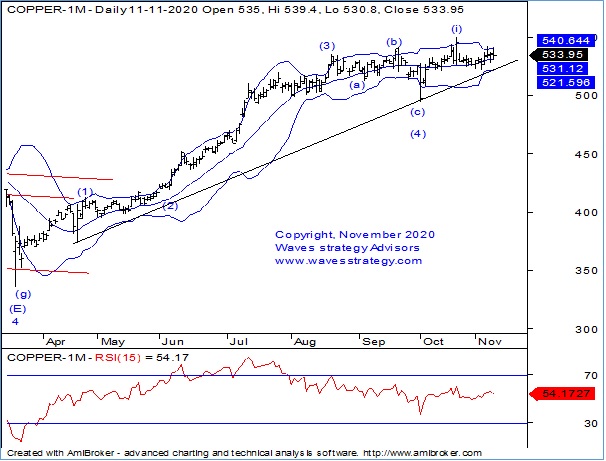
Copper daily chart:
(Below is the extract of the research from our Monthly report)
Anticipated on 15th November 2020: Copper has seen rise towards 549 levels on 23rd October 2020 the metal moved as expected in line of wave counts suggested. .
Copper saw gap down post forming a high near 549 levels. Now, prices are showing signs of retracement on the upside. Recently prices made a new low at 521 level and taken support from its ascending trendline and moving higher. It is important now to look at the medium term structure to understand the overall pattern. Now, it’s important to see if prices give breakout of its immediate resistance of range on closing basis than the bulls will probably challenge the previous top which is seen at 549 levels. Alternatively, additional declines may drive the price towards the 505-500 support, which lies near the 20-week exponential moving average.
Elliott Wave perspective: on weekly chart, we are seeing the impulsive rise of wave 5 blue currently the last leg in the impulse pattern is unfolding in the form of wave (5) blue. This last leg is a terminal impulse with wave (ii) might have completed near the lows of 523.
As seen on daily chart, currently the up move can be seen form of wave (iii) of the terminal impulse. In a terminal impulse, all the waves are expected to be corrective in nature.
The 20 period Exponential Moving Average is acting as a brilliant support line and it has provided support at regular intervals. This suggest that one should be in the direction of the on-going trend as far as this line is protected and any pullback towards the same should be utilized as buying opportunity.
Bollinger bands continue to provide important support and resistance and the resistance. So unless we start seeing bands expansion and decisive close above or below these bands prices can continue to consolidate. As we can see, post taking support near the lower bands prices have moved higher. Also if we see copper breaking above the upper band we can say that an upward rally has begun.
In a nutshell, the outlook for Copper looks to be sideways to positive. For a bigger degree uptrend to resume prices might inch towards 549 or higher levels. As long as 490 levels is protected on downside, the trend continues to be bullish.
To Get access to intraday/positional commodity calls and Research Report click here.
Trade with an Edge using these advanced methods but in a very simple way. Mentorship of Technical Analysis starts on 13th March 2021 which will focus on things every trader should know with prudent volatility based risk management, money management strategies, Intraday to Positional Trade setups and much more. Register NOW here or Whatsapp on +919920422202