Copper: Trade setup using wave theory with channels and candle stick pattern.
Mar 10, 2021
Our application of Elliott wave with combination of various indicators is helping us to gauge the movement before it happens.
On 8th March 2021 in “The Customized Commodity Waves short term update” we published detailed Elliott wave counts along with channels and candle stick pattern.
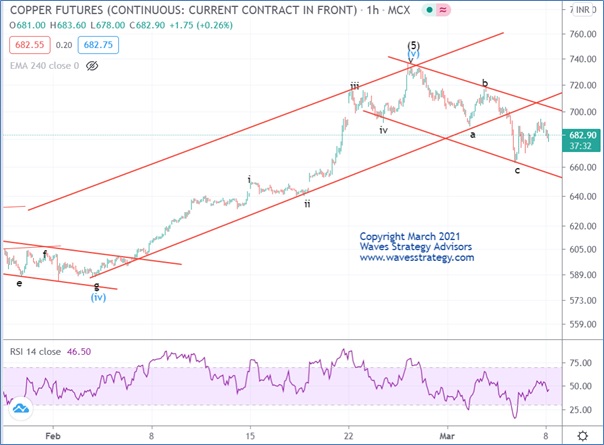
Copper 60 mins chart: (Anticipated as on 8th March 2021)
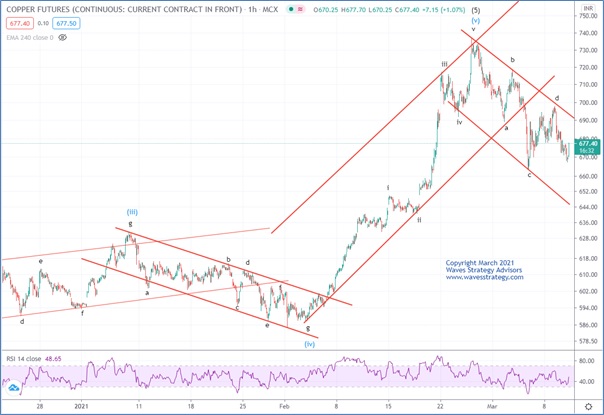
Copper 60 mins chart: (Happened as on 10th March 2021)
Wave analysis:
As shown on the daily chart, in the previous session the copper formed an inside candle. hence as per bar technique short term bias continues to remain bullish as long as we do not see a close below previous day’s low.
As shown on the hourly chart, Price has bounced from the channel support in the form of wave d. after a steep fall we expect a pullback which can be used as shorting opportunity. Closest support is placed at 702.
In short, Copper seems to be sideways to bearish. Use pullbacks as shorting opportunity for a move towards 675 as long as 702 levels hold on the upside.
Happened : Prices moved precisely as expected in line with indicators direction and neo wave pattern also it broke below the channel support decisively. We expected the deeper down move towards 667 levels and it happened as forecasted.
To Get access to intraday/positional commodity calls and Research Report click here.
Trade with an Edge using these advanced methods but in a very simple way. Mentorship of Technical Analysis which will focus on things every trader should know with prudent volatility based risk management, money management strategies, Intraday to Positional Trade setups and much more. Register NOW here or Whatsapp on +919920422202