Crude 75 Weeks Reversal Setup
Oct 14, 2020Time Cycles along with Neo wave can give the broader context for the market. Do remember it is not a signalling system but to understand the reversal zones. For precise signals it is important to see the short term charts right from 60 minutes to 15 minutes time frame.
Many traders jump the gun as soon as they see a bigger time cycle without understanding that time is a dynamic component and will not give exact entry unless it is applied on intraday charts.
Let us understand the broader context on Crude and how 75 weeks have worked for the bigger moves. The below chart was published on 10th September in the monthly research report.
What happening with MCX Crude?
Figure 7: MCX Crude weekly chart
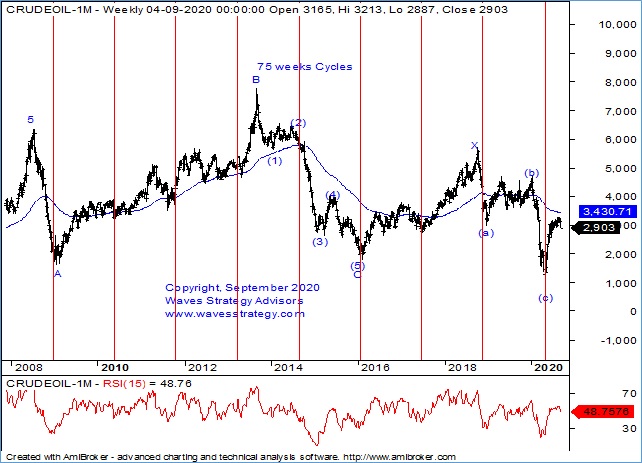
Elliott wave analysis: Crude had been in news over past few months due to the sharp movements we have seen in this commodity. We witnessed Nymex Crude entered negative territory that shook the entire financial world and many of the theories that never imagined a commodity can also trade negative. Let us see the trend of MCX Crude since the lows formed.
Wave perspective: As shown on the weekly chart of MCX Crude, it seems that the correction that started in 2008 is still not over and the rise seen in 2016 – 2019 was only wave X. The next set of downside correction is currently on-going and prices are now in wave (d). The closest support for Crude is now at …………. levels. So, keep a close watch near that support zone and if the same gets broken we might see a move back towards ……….. levels. On upside resistance is at ??? levels and for any positivity the same has to be taken out decisively. (the levels are shown in the actual research report)
75 Weeks’ Time Cycle: We are showing 75 weeks Cycle on the chart and this cycle has worked amazingly well in capturing the major lows. Post the cycle low formed near the life time low where wave (c) was completed buying was witnessed in form of wave (d). It only shows how amazing the cycles work on commodity markets as well and this Time Cycle has helped to capture major lows. It is big cycle which will turn bearish in around 35 weeks. Prices are currently trading in the first half of the cycle which is usually associated with the uptrend. However, it also indicates that the low made near April 2020 might remain protected but short term down move cannot be ruled out.
In short, Crude Oil is at a crucial juncture as of now but the downtrend over the bigger degree is not yet over. Any break below ………. levels will indicate that the downtrend towards ………. has started. On upside …….. is important resistance and only a move above it will be any sign of positivity.
Get access to the Commodity research report or Equity research report annually and get the “The Financial Waves Monthly Update” complimentary along with it. See more than 15 charts and all are interconnected. Subscribe here annually and my team will setup access to monthly free. Offer valid only for limited registrations.
Join me for the 3 months of Mentorship on Technical analysis starts in November 2020. It is important to understand how everything in connected together whether it is a fundamental or a technical parameter. I will be sharing more than decades of experience over the period and ensure you become a much better trader. There will be Q&A sessions and discussions ongoing post mentorship as well. So it is a long term association and commitment from my end to make you a wonderful Trader. Early Bird Ends on 25th October 2020.