Crude Oil : How to identify precise targets using Wave theory and Time cycles.
Jul 19, 2021
Its possible to forecast almost precise targets months in advance using Neo waves and Time cycles. Check for yourself how we analysed Crude Oil a month ago.
The following research on crude oil was published in “The Financial Waves Monthly Update” on 10th June 2021.
Figure 6 MCX Crude Weekly chart (as of 10th June 2021)

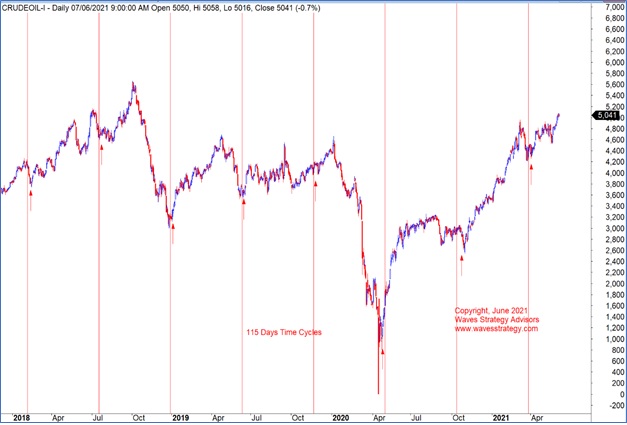
Figure 2: MCX Crude Daily chart with 115 days Time Cycles (as of 10th June 2021)

Post witnessing the crisis of Covid-19 in the month of February-March 2020, entire paradigm changed wherein Central banks at the Global levels took the front seat and provided higher liquidity to boost the economies. The same has continued till now wherein they have been providing ample financial stimulus. This led to the sharp rise across the asset classes. Crude is the major driver to understand the economics. As economies recover, demand increases which leads to higher prices and vice versa. WTI Crude prices recovered from the surprised lows of $ -40.32 to the highs of $70.63 levels till now. Similarly, MCX Crude prices rose from the lows near 0 to 5100 level. The momentum on upside continues to be strong as of now.
Now technically, the zone of $65-67 was very crucial in terms of resistance for WTI Crude prices however in the month of May 2021 it managed to close above the same. In the first week of June 2021 it has been witnessing follow up buying and tested the highs of $70.00 levels. This suggests that one more hurdle has been crossed now and next crucial target is placed at $75.50-$77.00 levels. On downside $61.00 is the immediate support level. Now let us look at the structure of MCX Crude with Neo wave perspective.
Figure 1 shows the MCX Crude weekly chart with Neo wave possibilities. Here we can see that prices broke above the downward moving trendline few months back and post that it sustained above the same. Recent break above the resistance zone is further positive sign from near term perspective.
Elliott Wave perspective: As shown on the weekly chart of MCX Crude, it seems that the correction that started in 2008 is still not over and the rise seen in 2016 – 2019 was only wave X. The next set of correction is currently on-going which is forming Diametric pattern. Prices are now moving higher in form of wave (e) within wave B.
We can see that the weekly RSI relieved from its overbought state and prices have managed to decisively break above the swing high of wave (c) confirming a bullish breakout. The rise of wave B is well within the rising channel and we expect price to continue to move higher towards the upper end of the trendline near $75.50-77.00 levels. 15-weeks EMA is proxy for the uptrend which has been providing crucial support.
Figure 2 shows the Crude Oil daily chart with 115 days’ Time Cycle. We have been adding components of Time cycles in to our analysis for more clarity and conviction. Here it has been following 115 days’ Time cycle very well. As per this, prices have recently bottomed out near 4400-4300 area and from hereon upwards acceleration can continue which is in sync with Neo wave counts.
In short, as per Neo wave theory, the recent rise is corrective in nature which suggests that Diametric pattern is under formation which has more legs pending as of now. It is best to follow the current trend which remains firmly positive. The zone of 4600-4500 will act as a crucial support from hereon. On upside it is likely to move higher towards 5600-5700 levels where trendline resistance as per prior highs are placed.
Figure 3 MCX Crude Weekly chart (as of 19th July 2021)

Happened: MCX crude oil was trading near 5060 levels when we published and it has made a high near the trendline around 5733 levels in the first week of July which exceeded the target of 5700 slightly as we mentioned !
To know the in-depth analysis from Elliott wave perspective, get access to the “The Financial Monthly Update”. You can also find detail analysis on Outperforming sectors and Global market view Subscribe here
Learn how to cash the chaos by understanding that the Elliott wave patterns and markets are moving in lock step fashion the way we have been expecting as per that pattern. Attend Become Market Wizard (BMW) Season-2 training covering two modules – Master of Technical analysis (MOTA) S-2 and most advanced training on Elliott wave, Neo wave with Time cycles (MOW) S-2. Register now over here or Contact us on +919920422202
