Decoding Zinc with Elliott wave and simple price action
Jan 19, 2021Trading can be very simple with the application of basic technical analysis but provided that it is in the right context.
Although we have Neo wave counts on the zinc chart below which give us a road map of price movement, we have mostly applied simple analysis to derive our view in our daily commodity report which you can see for yourself below.
Zinc hourly chart posted on 5th January in daily commodity report:
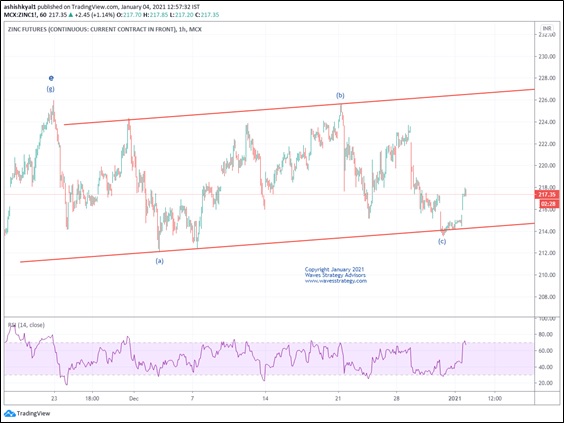
On the hourly chart, RSI dictates that values of 70 or above suggest that a security is becoming overbought and may be primed for a corrective price pullback. Here RSI indicator is placed above 70 levels hence the possibility of a minor consolidation cannot be ruled out which can be used as buying opportunity.
In short, ZINC seems to be sideways. Break above 217.50 on closing basis can push price higher towards 225 levels. On downside 212 levels is going to act as an important support.
What unfolded next:
Zinc hourly chart :
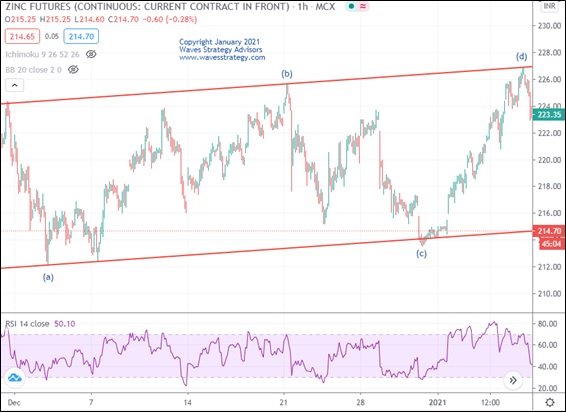
Zinc made a high near the channel around 227 after the next few days after breaking above 217.50. Such simple strategies can be used to trade in any security be it commodity, stocks or currency.
To Get access to intraday/positional commodity calls and Research Report click here.
Hurry up Grab your seat now!! 3 Months of Mentorship March 2021. Early Bird Ends on 10th February 2021.Learn How to trade right from scratch of understanding the context of market, Price action, plotting a chart to the indicators to Elliott wave, Neo wave, Time forecasting dates and much more in the upcoming 3 Months Mentorship March 2021 from the Author of an International book- Mr. Ashish Kyal. Get the complete details over here or contact us on +919920422202