Elecon Engineering on Point with Price action and simple Price Indicators!
May 13, 2025
It is possible to capture big moves in stock using price action along with simple indicators like the ADX (Average Directional Index)
We combined simple indicators like Bollinger bands with price action which helped us capture a move of more than 9% in Elecon Engineering Ltd. It's impressive how combining these simple indicators with price action can pinpoint momentum stocks for short-term trades, leading to substantial returns.
We published the following research on Elecon Engineering on 7th May 2025 in the “Vayu Momentum Report” which our subscribers receive pre-market every day.
Elecon Engineering Daily Chart Anticipated as on 7th May 2025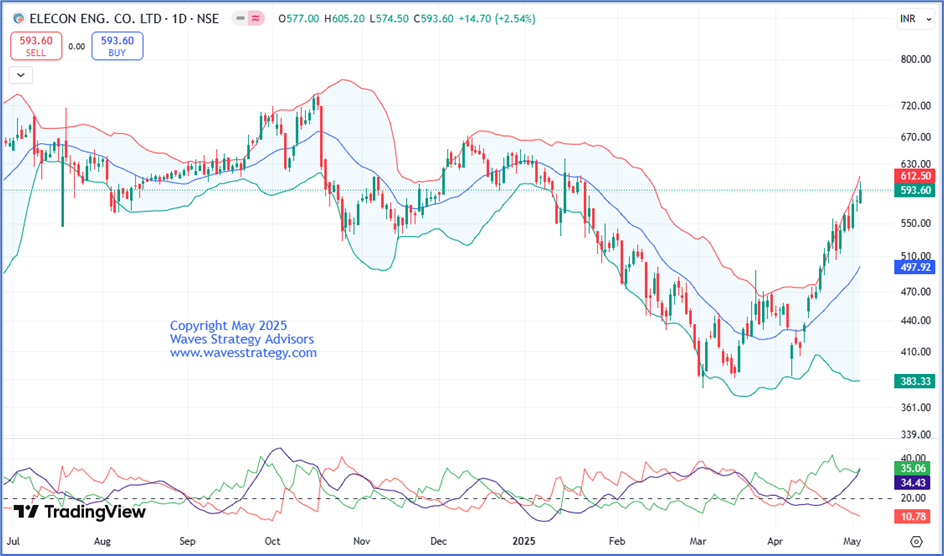 Wave analysis as on 7th May 2025-
On the daily chart, Elecon Engineering Ltd post reversing from the lower Bollinger bands® saw a sharp rally towards the upper Bollinger with a gain of more than 56% in span of 1 month. Also, since 28th April not a single candle has closed below prior candle’s low which is a positive sign. ADX is showing reading of 34 i.e. above 25 levels which validates the increasing positive momentum in the stock.
Along with this, prices have retraced 62.8% of its entire prior fall which started from October 2024 and for now we expect prices to retrace up to 78.6% i.e. near 660 levels.
In a nutshell, the current trend for Elecon is on the side of the bulls. A break above 605 levels can further lift prices towards 650-660 levels. On the downside, 585 is the nearest support to watch out for!
Key Resistance: 660
Key Support: 585
Strategy: Long positions can be created above 605 with the stoploss of 585 and target of 623 followed by 650 levels
Elecon Engineering Daily Chart Happened as on 13th May 2025
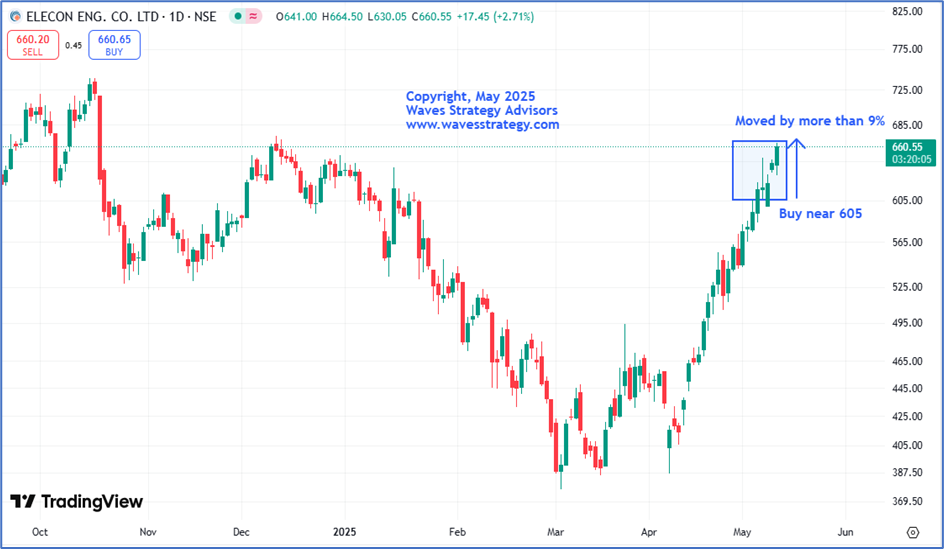 Happened as on 13th May 2025:
Elecon Engineering has been in sync with our expectation as after we published the report, the stock has been inching higher day by day and BANG ON!! The stock managed to achieve both our given targets in just a matter of 3 trading sessions which is a strong bullish sign. Also, prices surged by more than 9% since then and made a high of 666.50 levels.
We successfully captured this entire up move with the help of simple indicators like Bollinger bands and ADX (Average Directional Index). One needs to combine it with price action for more accurate setups.
It is fascinating to see how accurately combining basic indicators along with price action can help to predict price targets with higher accuracy.
Brahmastra (Mentorship) on Timing the market – Equip yourself with tools of Elliott wave, Neo wave, Time cycle, stock selection algo creation, multibagger and momentum stocks identification along with exact trade setup that actually works. Only a few seats left! Fill below form for more details.