The Power of Timing the Market - Eternal 3rd Wave Movement!
Sep 29, 2025
Elliott wave when combined with Price action leads to interesting results. By using Time cycle and wave theory together it can help predict capture reversals way before it has happened.
Novices think of getting at exact lows and getting out at exact highs but expert traders try to capture the best of the 3rd wave and wait like an eagle for that exact moment to catch the prey most of the time.
The following research is picked from our Aakash monthly report of April month 2025.
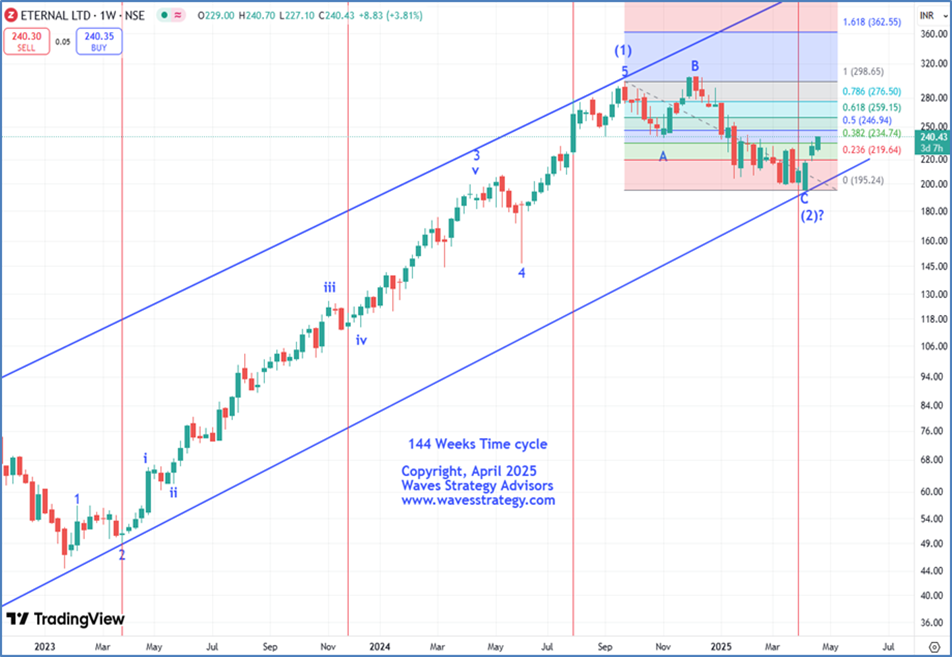
Eternal Ltd Weekly chart with Time Cycle: Anticipated as on 22nd April 2025
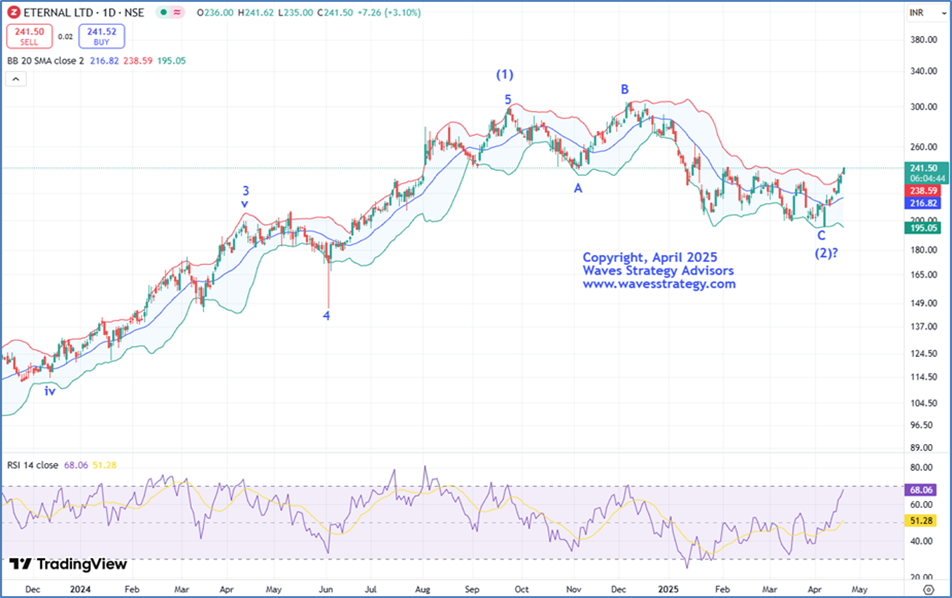
Eternal Ltd Daily chart with Wave Theory: Anticipated as on 22nd April 2025
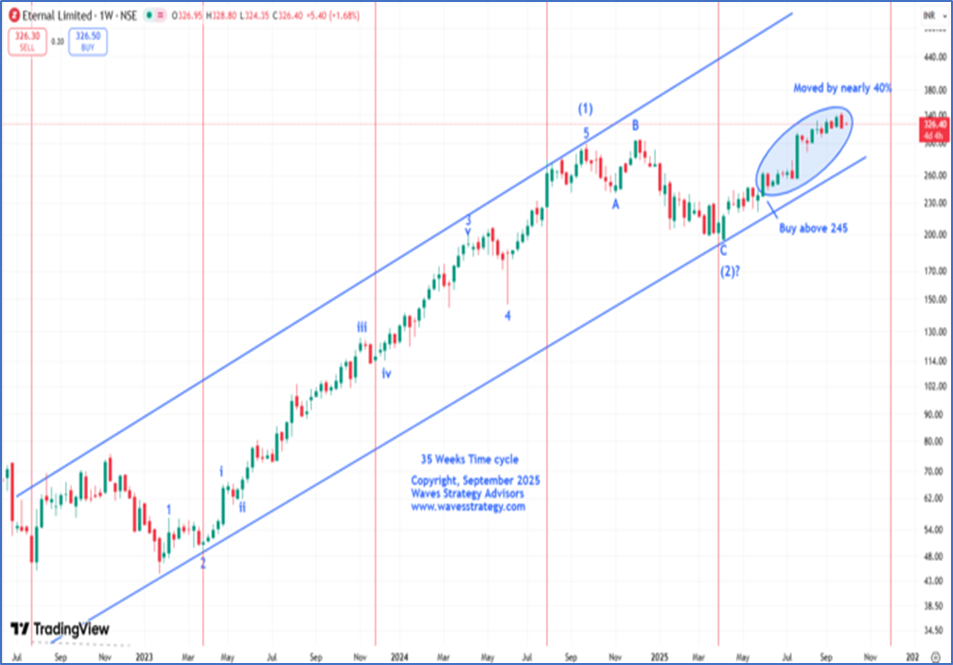
Eternal Ltd Weekly Chart: Happened as on 29th September 2025:
Anticipated wave Analysis as on 22nd April 2025
Eternal Ltd is the newest entrant in Nifty 50. The stock has been moving within a multiyear channel since July 2022 signifying strong trend in the stock. Now let’s understand the view for Eternal with the help of advanced technical tools.
The stock is following classic Elliott wave theory. Wherein, Primary wave (1) recently got completed on the upside in September 2024 and since the entire fall has been unfolding in the form of wave (2) which is further subdividing in nature. Wherein, it looks to be unfolding in the form of an irregular flat pattern (3-3-5) as wave b has retraced more than 100% of wave a. For now, a decisive break above 245 levels can confirm completion of wave (2) on the downside. Then the rise would be in the form of primary wave (3). As per the Elliott wave guidelines, it is considered to be the strongest wave.
Weekly chart- Prices recently found support of its multiyear channel and reversed on the upside which is positive sign. In the previous week, price has closed above prior candle’s high which is giving us hints about possible trend change on the sides of bulls. However, for confirmation acceptance above 246 is must. Also, prices have retraced more than 38.2% of the prior fall and now with follow up buying we can expect prices to retrace minimum to 61.8% i.e. 259 levels.
On the daily chart, we have applied Bollinger bands® to gauge price action and volatility in the stock. Since reversing from the lower Bollinger Bands® on April 7th, the stock has consistently protected its prior day's low on closing basis suggests that bulls are tightening their grip by each day passing. As prices have managed to complete its journey towards the upper bands which reinforces strength in the ongoing trend.
144 Weeks’ Time Cycle – Time cycles are another amazing technique which helps in capturing lows and highs from time to time. Every stock has its own Time cycle and here on the Weekly chart, we are showing 144 Weeks’ Time cycle, it is really effective in capturing the major low points. Currently, prices have already entered into its cycle zone which was due on 1st April and has formed a short-term low near 194 levels. For now, we expect prices to break above 245 levels can confirm that cycle has turned on the buy side.
In a nutshell, the current trend for Eternal looks to be bullish. A break above 245 levels is must for bullish momentum to continue which can lift the prices higher towards 285 and eventually to 320 levels. On the downside, a break below 210 levels which is a channel support will be a sign of trend change.
Happened as on 29th September 2025:
In our monthly report, as expected Eternal Ltd danced on the tunes of our advanced technical tools and BANG ON!! Prices broke above 245 levels and saw an exponential rise of nearly 40% in just a span of 5 months. This helped prices to surge through our given targets and make a lifetime high of 343 levels in the previous week. We were able to predict this rise before it actually happened using Time cycle, Wave theory and Price action.
Brahmastra (Mentorship on Timing the market) – Over period of 3 months equip yourself with all the tools to trade the market with an edge of Time cycles, Elliott wave, Neo wave concepts that can be used across all markets, Options strategy, access to a private community group, stock selection scanner, Multibagger and Momentum stock identification technique, Mentorship sessions for the complete trading journey. Fill the form below for more details: