
GESHIP Stock Rally Alert: Gann and Time Cycle Turn Accurate!
Oct 29, 2026
The Gann Square of 9 is a simple yet powerful tool for identifying key support and resistance levels, based on the principle that price moves in mathematical harmony. Certain levels act as magnets until they are decisively broken.
Most traders grow up hearing that timing the market is impossible. However, Time Cycle analysis proves otherwise. Markets move in rhythmic cycles, and these cycles often repeat with remarkable consistency across instruments and timeframes.
When combined with time-cycle analysis, it helps pinpoint high-probability turning points.
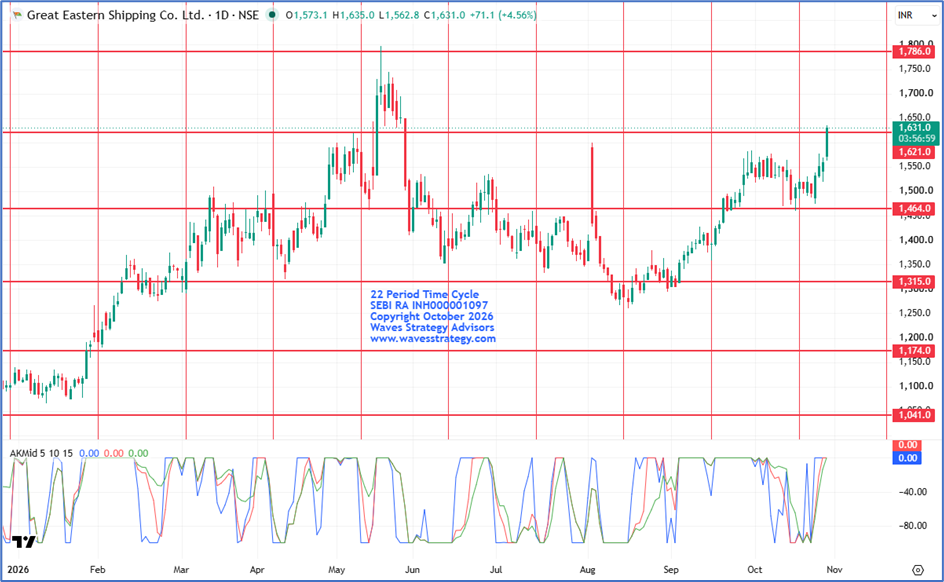
GESHIP Daily chart with Time cycle and GANN square of 9
Time Cycle
- The chart highlights a 22-period time cycle that has effectively identified lows in GESGHIP.
- The stock tends to form a low approximately every 22 days, as captured by this cycle.
- The most recent low occurred around 19th October 2026.
- Since then, the stock has rallied nearly 12%.
- This price movement underscores the potential significance of the time cycle in identifying market lows.
Gann square of 9
- The horizontal lines represent Gann Square of 9 levels, acting as key support and resistance.
- In today’s session, stock surged nearly 5% and gave decisive break above 1631 Gann level which could signal further bullish momentum.
- GESGHIP is currently comfortably trading above the crucial Gann level of 1631.
- The next upside target is around 1786 as per Gann level.
AK Indicator
- The AK Indicator is a custom-built tool used to track trend maturity, momentum and trend strength.
- On the AK Indicator, all three lines have recently converged towards the 0 line, any follow up buying can potentially turn the indicator on the buy side providing double confirmation. This suggests that bullish momentum is likely to continue.
Conclusion
- In a nutshell, GESGHIP is currently trading above the Gann level of 1631, traders can use dips as an opportunity to ride the ongoing trend as long as key support of 1590 level remains intact.
Learn Advanced Technical Analysis with Brahmastra
Brahmastra — Technical Analysis Mentorship
Learn the science of trading with algo creation, stock selection, options trading, Elliott Wave and Neowave.
In the Brahmastra sessions, you will learn how these concepts can be combined to develop a structured approach to market analysis and trading. Fill below form for more details: