Gold losing its luster as per this pattern
Mar 02, 2021
It’s very easy to capture big moves in gold when using neo waves along with simple techniques like the channeling technique.
Look for yourself how our clients were able to capture a large move in gold yesterday which we mentioned about in our daily commodity report.
MCX Gold 60 min chart as published on 1st March 2021:
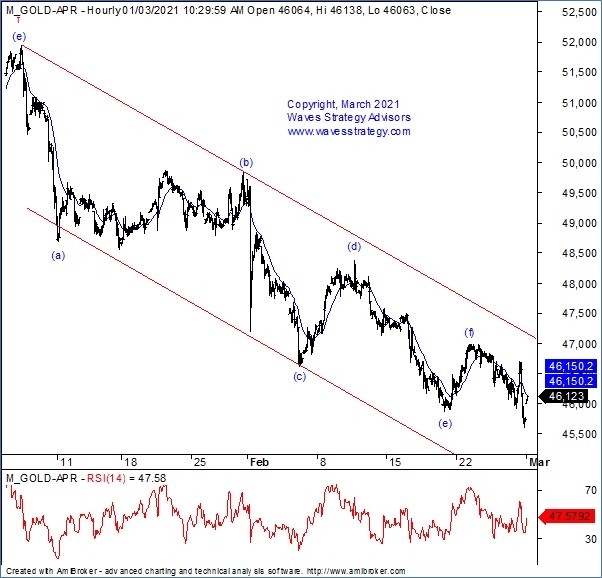
Wave analysis: the daily chart, Gold has been drifting in the form of wave (iv). In the previous session the commodity formed a red body candle and closed below the prior day low. As per the bar technique the short-term bias is bearish as long as the prior day high remains protected on a closing basis.
As seen on the hourly chart, wave (iv) is forming a diametric pattern and currently price is in wave g. Within wave g we can see that as of now wave (g) is ongoing. Any pullbacks can be used as shorting opportunity for a move up to 45500 levels.
In a nutshell, the trend for MCX Gold seems to be sideways to bearish. Use pullbacks as shorting opportunity for a move towards 45500 as long as 46320 hold on the upside.
MCX Gold 60 min chart as of 2nd March 2021:
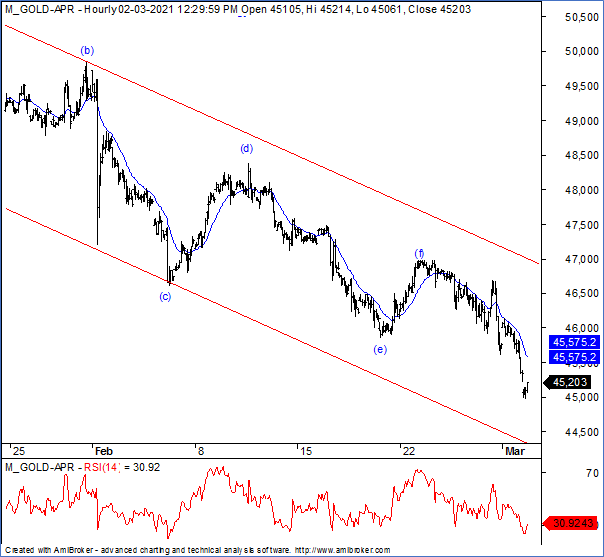
Gold made a low of 44975 as of 2nd march and gave much more than the conservative target which we mentioned.