Gold – Will it Glitter Again? Time + Neowave
Mar 01, 2023
Like this Article? Share it with your friends!
Gold has lost its shine over the past few days but will it glitter again?
Below is a short-term Analysis of MCX gold using Elliott waves, Time cycle and price action technique which we published this month in our Monthly report.
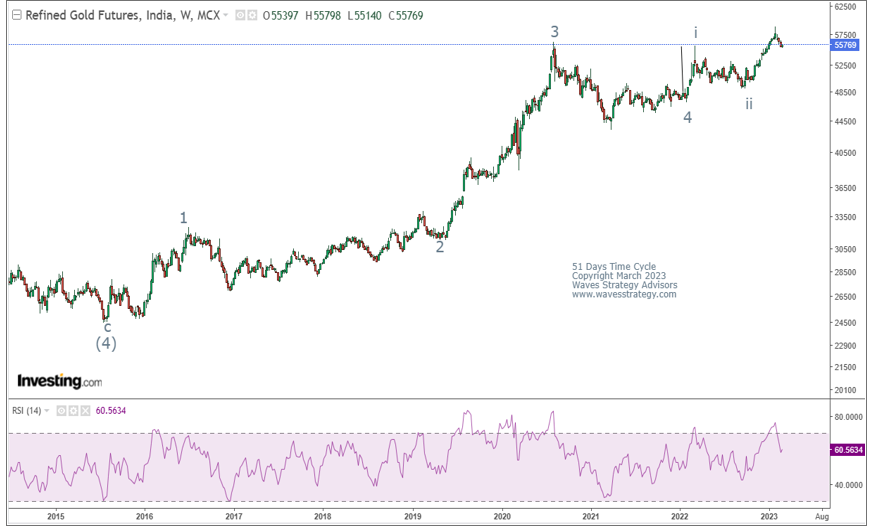
MCX Gold weekly chart
MCX Gold daily chart: 
Wave Analysis:
Gold showed a strong start in the New Year by trading in the positive territory. The gold continued to rally in the month of January due to expectation of easing inflation and also due to possibility and expectation of low interest rate hike in the near future which opens possibility of explosive move for gold for the months to come and which also suggests less hawkish moves from the Federal Reserve after a rapid rise in interest rates through 2022.
MCX Gold Neo wave perspective on weekly chart: As per wave perspective, in the mid of 2016 primary wave (4) completed and since then primary wave (5) is ongoing which is subdividing in nature. In the first quarter of 2022, intermediate wave 4 of primary wave (5) finished its course in form of Triangle pattern and since then intermediate wave 5 is ongoing wherein minor wave ii has completed on the downside and the recent up move that we are witnessing is in form of wave iii which is considered as a strongest one.
On the daily chart, Gold made a high of 57200 in the last week of the previous month. The medium-term trend for the metal is still on the upside as prices are still trading above its medium-term i.e. 100 Exponential moving averages in the positive zone. After a steep rally which lasted for 3 months, currently we are witnessing some profit booking and short-term correction towards 56000 levels can be seen which is in the form of intermediate wave iv. After completing wave iv on the downside fresh buying can be seen. However, If Gold trades below 55000 then it may fall till 53600 on the lower side.
In a nutshell, after a sharp rally we are witnessing short term correction. However, Gold overall trend is on upside and any dips should be a buying opportunity in this asset. Move above 57000 will confirm upside reversal for a trend towards 59000 levels. However, any move below 55000 will suggest few more weeks of correction before wave v starts higher.
3 Months of Mentorship on Timing the Market – Above chart simply shows how price action along with Time cycle and Neo wave can be combined. A Mentor can ensure that proper application of these methods is passed across so that it can form a powerful system to generate that parallel source of income. Be a part of Elite traders community we call as #TimeTraders. Fill below form for more details: