HDFC BANK Ltd TIME TO BUY? Volume Profile and Advanced Elliott wave.
Oct 29, 2025
HDFC BANK Ltd has picked up its gains since the past few session. But when is the time to buy?
Simple price action using Volume analysis along with advanced Elliott wave – it provides clear guidance for trading stocks over short to medium term.
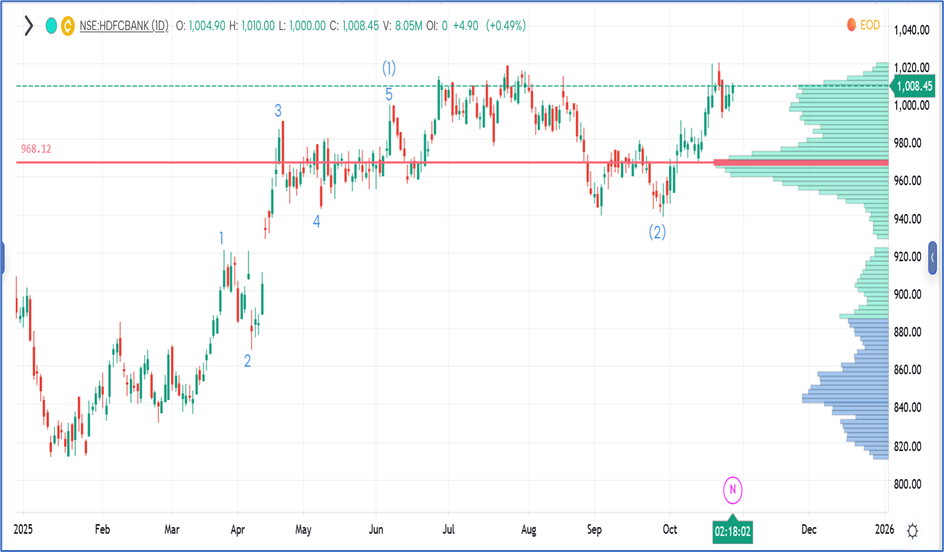
HDFC BANK Daily Chart Neo wave and Volume profile
Volume profile indicates big players activity and same can be applied prudently even for Options Trading.
Options Trading requires understanding of momentum, trend, time to expiry and range.
Majority focus only on Volume profile but by combining change of Volume profile along with Advanced Elliott wave on stocks, indices the overall perception can sharply increase.
On the daily chart, one can observe how HDFC Bank is exactly moving as its Neo wave counts. The entire impulse rise since February 2025 has been in the form of Primary wave (1) which got completed in the month of June 2025. Post which, the entire correction had been unfolding in the form of Primary wave (2). As the recent rise retraced its prior leg in faster time it suggests that wave (2) got completed on the downside and now a fresh leg has started to unfold in the form of Primary wave (3) which is considered the strongest terminus as per the guidelines.
When we combine the same with Volume profile, prices on 6th October 2025 decisively broke above its Point of Control Area (where the highest cumulative volume has taken place) of 968 levels this level acts like a resistance or support. Post prices broke above it, it has managed to extend its gains and gave an entry opportunity to ride the ongoing trend. One can look forward to buy calls or futures according to their narrative.
In a nutshell, witness the power of wave (3) with breakout from its POC levels. For now, a break above 1020 levels can further boost bullish momentum towards 1060 followed by 1100 levels. On the downside, 980 levels is the nearest support to watch out for!
Brahmastra (Mentorship on Timing the market) – Learn to time the market to the very Day, Hour and Minute by combining the concepts of Hurst’s Time cycle on Index and stocks as well, Gann square of 9, Elliott wave, Neo wave and be a part of elite trader’s community who are Time Traders. Fill the form now: https://www.wavesstrategy.com/mentorship-form
Trishul Membership – Options Trading with Elliott wave, Neo wave, Ichimoku cloud, and sacred science of trading & forecasting is covered in the Options Mantra Live Sessions - 8th - 9th Nov & Sutra of Waves Live Session - 6th - 7th Dec. Limited seats available.