How to capture Momentum in Hero MotoCorp using Wave Theory with Fibonacci Series!
Jun 11, 2025
When combining basic price action and Advanced Elliott Wave with technical tools like Fibonacci retracement, it can lead to remarkable results in trading.
Advanced Elliott wave helps to understand the overall maturity of the trend and if the rise is sustainable or not.
Following research is picked up from Vayu Momentum short term update dated on 28th May 2025 which our subscribers receive before market opens.
Hero MotoCorp Daily chart Anticipated as on 28th May 2025.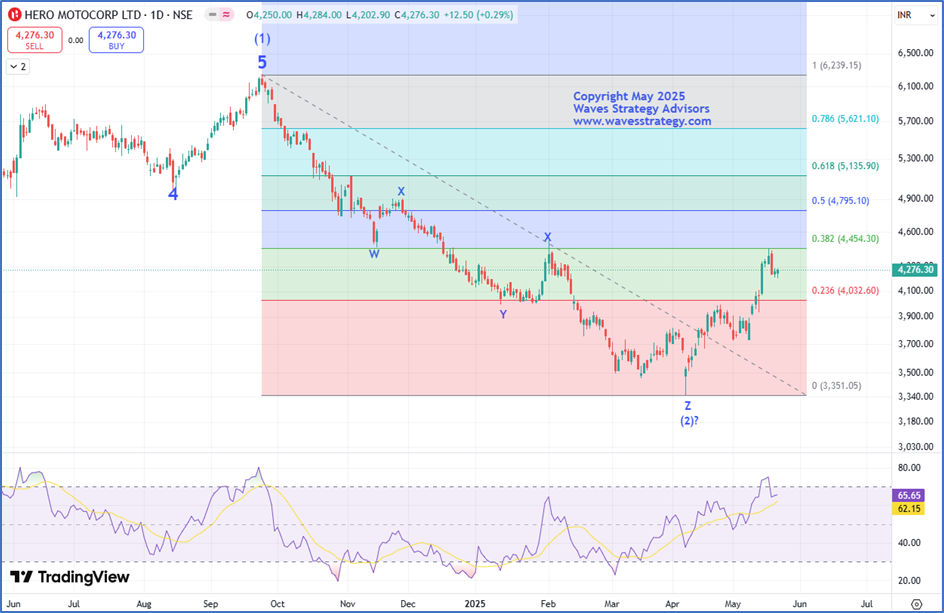 Hero MotoCorp Hourly chart Anticipated as on 28th May 2025.
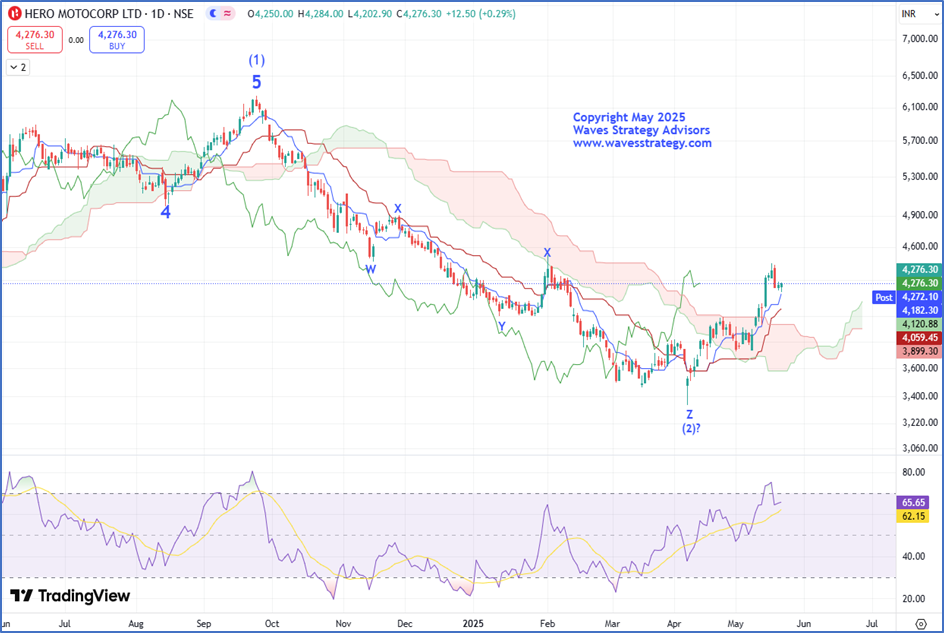 Anticipated Wave Analysis as on 28th May 2025:
Auto sector is one of the top performing sectors since the start of May which is a positive sign. Despite Nifty showing weakness since past few sessions, Hero MotoCorp has managed to hold its gain which is a strong bullish indication. Recently, prices witnessed a rally of more than 19% post reversing from the Ichimoku clouds in the start of May suggesting increasing bullishness in the stock. As of now, prices looks to be digesting the rise witnessed which also gave RSI the time to cool off and now a close above prior day’s high is needed for bullish momentum to resume in the stock.
As per the wave perspective, recent entire correction was in form of a wave (2) which looks to have completed on the downside in the form of double complex correction pattern(w-x-y-x-z). The current rise has retraced nearly 38.2% i.e. 4450 levels of wave (2). Prices can retrace minimum up to 50% the fall which comes near 4795 levels.
In a nutshell, the current trend for Hero MotoCorp is positive. A break above 4290 levels can lead to a trending move towards 4450 followed by 4795 levels. On the downside, 4140 is the crucial support to watch out for!
Trading Strategy for Intraday futures – Long positions can be created above 4300 levels with the stoploss of 4277 levels and target of 4323 followed by 4345 levels.
Trading Strategy for Positional futures – Long positions can be created above 4300 levels with the stoploss of 4254 levels and target of 4393 levels. (One can book part profit near 4333-4345 levels and trail stoploss to cost.)
Hero MotoCorp Hourly Chart: Happened as on 11th June 2025.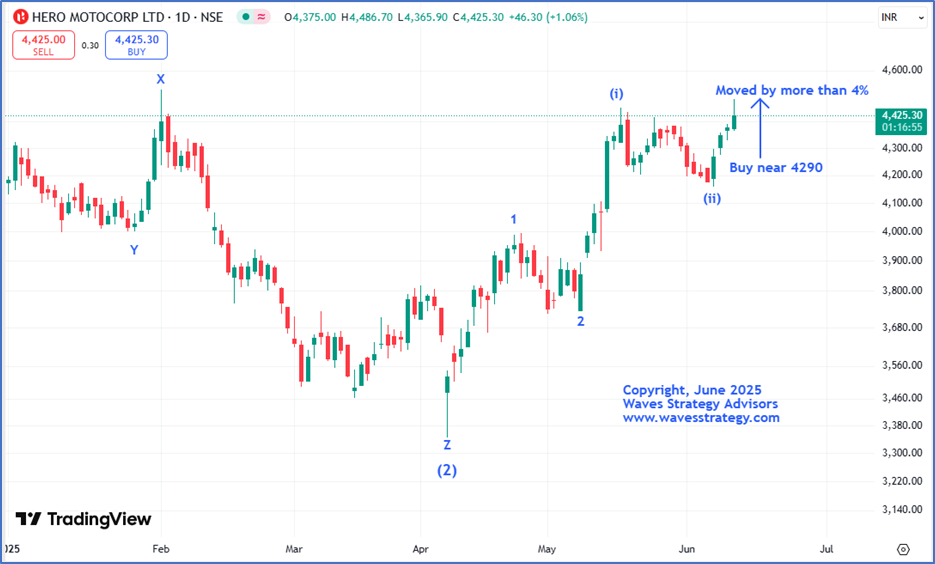 Happened as on 11th June 2025:
Hero MotoCorp is following classic wave theory. Auto sector has been consistently outshining the other sectors. Wherein, Hero MotoCorp has been one of the top gainers of the sector which has been in sync with our expectations and BANG ON!! We managed to capture movement of more than 4% in short span of time. Prices also achieved our given targets in futures segment as well.
We successfully captured this entire up move with the help of Fibonacci series which helps us to derive important support and resistance levels. One needs to combine it with wave theory for more accurate setups.
It is fascinating to see how accurately advanced Elliott wave along with simple indicators can help to predict price targets with accuracy.
In a nutshell, the overall trend remains on the positive side until we see a close below prior day’s low. On the downside, 4155 levels is the crucial support.
Trishul Membership - Transform the way you trade with the power of Neo Wave forecasting, In-depth training on Ichimoku Cloud, Elliott Wave, Master of Technical Analysis and the 5 Mantras of Options