The Hidden Elliott Wave Pattern in NALCO You Should Watch
Apr 27, 2026
Combining Elliott Wave Theory with price action helps traders identify high-probability setups. Beginners chase small moves, while experienced traders focus on capturing the strongest part of the trend.
By aligning wave structure with real-time price action, traders filter market noise and trade with greater confidence.
Let us understand how combination of ADX and DI with Elliott wave works together
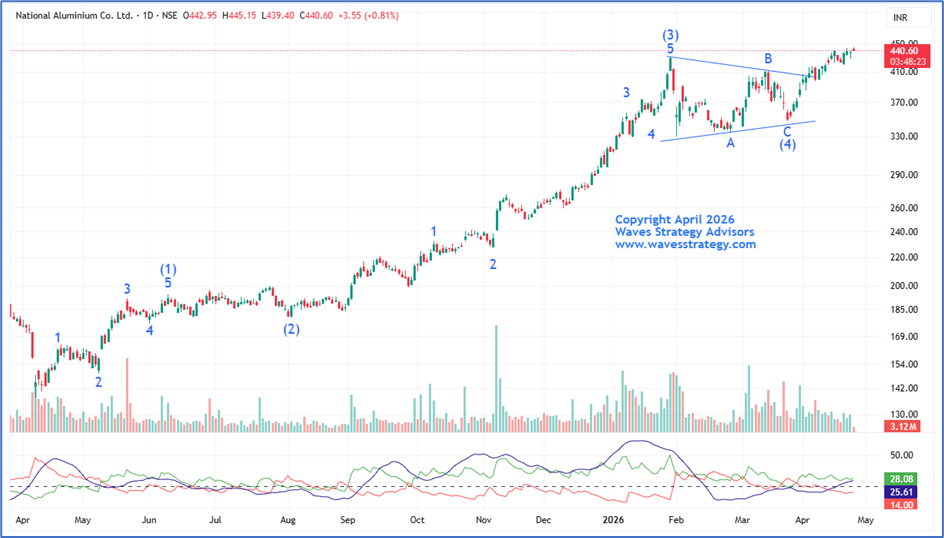
NATIONALUM Daily chart
Elliott Wave acts like the market’s GPS, helping gauge the maturity and direction of a trend. When wave counts align with price action, the outcome can be powerful—even in individual stocks.
Elliott Wave analysis continues to act as a reliable guide to assess trend maturity and direction. In National Aluminium Co ltd, price action remains well aligned with its wave structure. After completing Intermediate Wave (3) in January 2026, the sideways move was in the form of wave (4) which appears to have been completed near 347 level and now the up move has begun in the form of wave (5). This phase will be most likely the last phase of buying.
ADX and DI: The ADX and DI indicator indicates whether an instrument is developing momentum or not. If the indicator is showing a reading of above 25 level it means the stock is developing momentum while a reading below the 25 level indicates that there’s no momentum. Currently the indicator is showing a reading of 25 level signalling a potential move on the upside.
How does this help?
- Elliot wave can help in identifying market direction
- ADX and DI indicator can help in catching momentum
Conclusion:
Currently the stock is trading within the wave (5) pattern. This is most likely the last phase of the buying. So, traders should remain cautious and not ignore any potential trend reversal. For now, one can create positions once the stock break above the 445.15 level which can push prices higher towards 460 or higher with key support being around 418 level.
Brahmastra: Go Beyond Price – Learn Time Cycles
Brahmastra is a 3-month intensive journey focused on:
- Time Cycle Analysis
- Combining Time + Elliott Wave
- Precision in identifying turning points to the day
Includes
- Tradership sessions
- Full access to Trishul Program
- Structured trader development approach
This program is built on a powerful belief:
Markets can be timed—not just analyzed.
👉 For more details, click here
Trishul Program: Master the Three Pillars of Market Understanding
Trishul is designed as a structured learning pathway combining three powerful frameworks:
- Options Mantra (Online Videos)
- Elliott Wave (Foundation to Advanced)
- NeoWave (Advanced Forecasting tool & Precision)
What You Learn
- Event-driven options strategies
- Expiry-day income frameworks
- Risk-reward based trade construction
- Tools like Keltner Channels & KST
- Practical stop-loss & execution discipline
This is not theory—it is applied market understanding.
👉 Limited seats only. Fill the form below to apply.