How to capture trend reversals in crude oil
Mar 05, 2021
This is a simple is simple tutorial on how to easily capture trend reversals in crude oil.
Yesterday we generated a buy call on crude oil at around 4:25 pm. Checkout how this call was generated using price action trading strategies and Bollinger bands.
MCX Crude Oil March futures 15 min chart:
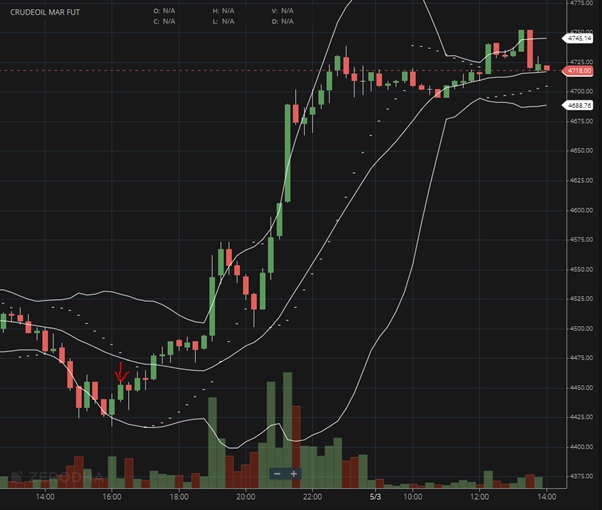
In the above 15 min chart of MCX crude we can see that price was riding along the lower Bollinger band indicating a short-term downtrend. Every consecutive red candle could not manage to close above its prior candle high.
The lower Bollinger Bands act like a support for price but to act upon it one needs price action confirmation. Notice the green candle with the red arrow above it. It was the first candle to close above the prior candle high which had bounced from the lower Bollinger band support. This is a bullish sign and a buy call was generated above the high of the signal candle. The stop loss was placed below the freshly formed swing low. The Parabolic SAR approaching price was another added confirmation to the bullish bias.
Exit strategy can be based on your preference and personal trading style. We were expecting price to move at least up to the upper Bollinger bands.
Below is the call which we had given to our positional commodity call subscribers.
POSITIONAL CRUDE FUT BUY ABOVE 4445 SL 4385 TGT 4535
To Get access to intraday/positional commodity calls and Research Report click here.
Trade with an Edge using these advanced methods but in a very simple way. Mentorship of Technical Analysis starts on 13th March 2021 which will focus on things every trader should know with prudent volatility based risk management, money management strategies, Intraday to Positional Trade setups and much more. Register NOW here or Whatsapp on +919920422202