How to identify Momentum Stocks Using Elliott Wave
Oct 19, 2020Novices think of getting at exact lows and getting out at exact highs but expert traders try to capture the best of the 3rd wave and wait like an eagle for that exact moment to catch the prey most of the time
So, it’s time the trade setup, wave patterns are all getting very clear and I will come out bold again against the crowd if market confirms by breaking important levels
So, see all by yourself and get access to Momentum Research.
We generated buy call under Momentum Stocks on Astrazen on 10th August 2020 and we achieved our partial profit levels as our studies showed.
See below what did the chart suggests:
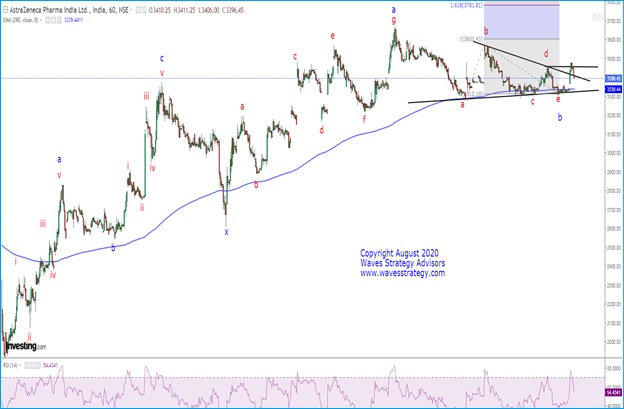
Astrazen hourly chart: Momentum call given on 10th August 2020
Momentum stock recommendation: AstraZeneca Pharma India ltd
Buy Price – Buy above 3460
Time Horizon –Not Applicable
Investment – 5% of capital
Target price –3750
Partial Profit: 3599
Stop loss–3300
Wave analysis:
With a boom in the Pharma sector almost every stock is flying off making it risky to enter randomly. AstraZeneca offered us the best risk reward scenario with a clear pattern formation.
On the hourly chart of Astrazen we can see that a complex corrective pattern is unfolding on the upside with its second leg ongoing. Within the second leg of this complex correction we can see that wave b (blue) formed a triangle pattern. The 290 hour EMA has been acting as an important support level and as long as price does not decisively break below it the short term bias continues to remain bullish. The hourly RSI has also broken above its previous swing high which shows a clear shift in range and mostly indicates that a trending move has started and the consolidation phase is over.
Looking at the internal counts of wave b (blue) we can see that price broke above the high of wave d (red) in faster time that wave e (red) took to form. This means that the last falling segment within wave b (blue) was taken out in faster time, which confirms that wave b (blue) is in place and wave c (blue) has started on the upside. As per the post pattern implication of a triangle pattern which formed in wave b, the 100% Fibonacci extension of wave a(red) projected form the base of wave e(red) comes to 3600 hence we have given 3599 as a partial profit booking level as sometime the 3600 level can act as a psychological resistance level. Also the 161.8% extension comes at 3780 level; hence we have given the target of 3750 where full profit can be booked. The stop loss level is below the low of wave b (blue), i.e. 3300 because any break below this level will invalidate our view.
In short, trend for Astrazen looks to be positive for now. As price has broken above 3460 we expect it to reach a target of 3750 based on our analysis. But book part TP near 3599 level to ensure risk is reduced and trail the stop loss of the remaining position at cost i.e. 3460. The initial stop loss is 3300 and view remains valid as long as this level remains protected.
Momentum calls: During such times it is important to capitalize by buying the stocks that can show momentum along with broader market. Always remember not every stock will move the way we expect but it is important to maintain strict stoploss as these are high risk trades but with potential to give the max gain in shortest possible time. Gets access now to recent Momentum published as the momentum starts building UP. Click here
November 2020 Mentorship: I will be covering various such indicators and strategies which can be applied across all asset classes. It can be attended by any type of trader right from Beginner to Expert trader as the methods will be different then you might already know with complete objectivity and deriving important dates, Register Now here or Contact / WhatsApp on +91 9920422202.
Early bird ends on 25th October 2020! Hurry up limited seats. Fill the form here-