How to trade a trend using Bollinger Bands strategy
Mar 15, 2021
Many strategies can be designed around the Bollinger bands. In this article we will discuss a simple trend trading strategy using the Bollinger Bands.
Nifty 15 mins chart:
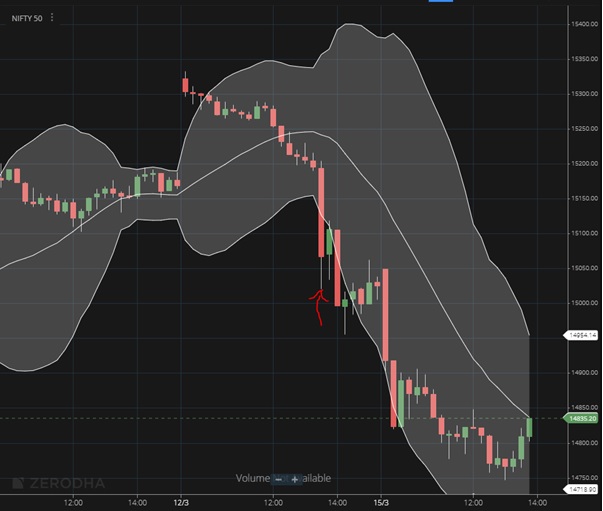
The strategy is very simple . Once we see a close above the upper Bollinger band then we enter long a long position once price breaks above the high of the breakout candle while keeping the mid Bollinger band as the stop loss or the low of the breakout candle as the stop loss. One can book profit when price break below the mid Bollinger band again.
Similarly we a close below the lower Bollinger band represents the start of a downtrend and one can short sell below the low of the breakout candle. Keep the high of this candle as the stop loss or the mid Bollinger band as the stop loss. Book profit when price again breaks above the mid Bollinger band.
We have shown a 15 min chart of Nifty . Notice that the red candle shown with a red mark closed below the lower Bollinger Band. This indicates that a short term downtrend has started. A break below the low of this candle was the sell signal and the stop loss was just above the high of this breakout candle. Notice that price is about to cross the mid Bollinger Band which is where the short position can be squared off.
This is a simple strategy which can be used to trade trending markets and to ride the trend to maximize profit.
To know the key levels and details outlook on Nifty using most advanced technical analysis methods get access to “The Financial Waves Trading Update” over here
Trade with an Edge using these advanced methods but in a very simple way. Mentorship of Technical Analysis which will focus on things every trader should know with prudent volatility based risk management, money management strategies, Intraday to Positional Trade setups and much more. Register NOW here or Whatsapp on +919920422202