IBULHSGFIN: Tanks 7% down, Know What Bollinger Band has hinted
Aug 31, 2020While trading the market it is important to understand the behaviour of the market. We believe that basic as well as Advanced Elliott wave can help to capture the next trend.
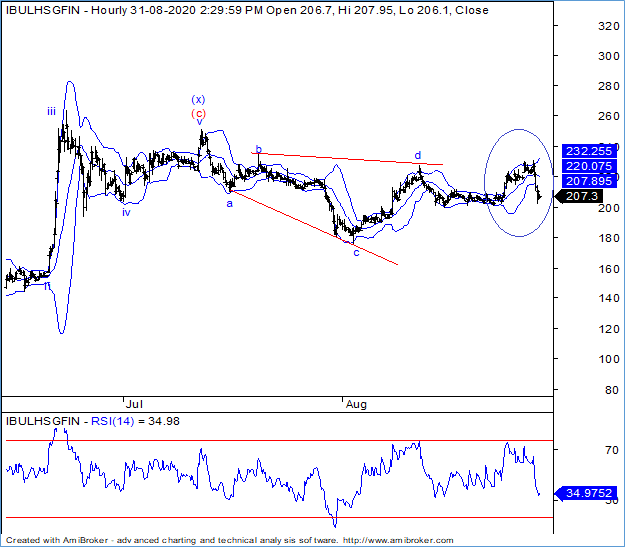
In today’s session sharp fall in IBULHSGFIN was witnessed from 229(today’s high) to 202 (today’s low) levels. Such sharp fall can be surprise for many investors or traders however we have been closely keeping watch on crucial levels and with help of additional indicators we were able to hint the down move.
IBULHSGFIN hourly chart:
Wave Analysis:
The stock is moving in a complex corrective fashion wherein wave (x) (blue) of the intermediate degree seems to have terminated near 250 levels. Currently next leg of correction has begun.
As shown on the hourly chart, the internal count of next leg suggests to be moving in the form of Diametric pattern. Move below the lower Bollinger band will drag prices down which could be in the form of wave e (blue). Also you can see prices have reversed from the upper band as it could not sustain above it. Sharp selling was seen once Nifty index started moving down steeply.
In today’s session prices have seen break below the lower Bollinger band which indicates negative can continue. Also now given the fall some consolidation cannot be denied in further sessions.
You can also understand what mechanism is used behind the Bollinger band and Elliott wave through our research reports which as clear mentioning and explanation of the current ongoing trend of the particular stocks.
The above analysis clearly shows that along with Elliott wave combining indicator such as Bollinger Band. Get access to the intraday calls, daily equity research report & capture such amazing trading opportunity over short term Know more Click here