Ichimoku Cloud most powerful directional indicator applied on Dr.Reddy
Jun 10, 2020Stocks within the pharma space we can clearly see strong outperformance by Cipla and Dr.Reddy in the large cap category. The overall chart pattern looks very interesting see below.
The Ichimoku cloud is a handy tool that assists in counting and confirming neo wave counts. The combine application of neo waves and Ichimoku gives more objectivity to a trader.
Below is the chart we published in our monthly report, “The Financial Waves Monthly Update”
Dr.Reddy Weekly chart: (Anticipated as on 8th April 2020)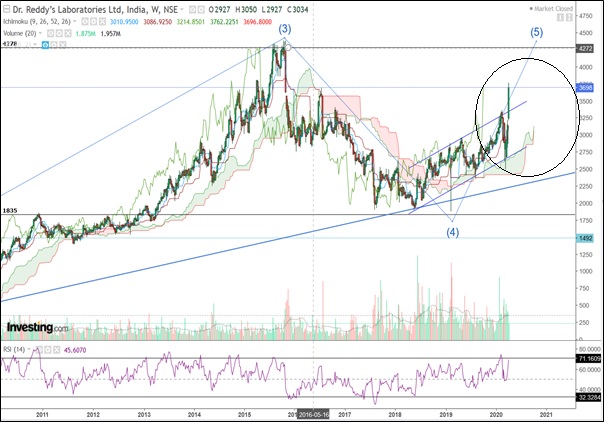
Dr.Reddy Daily chart: (Happened till now)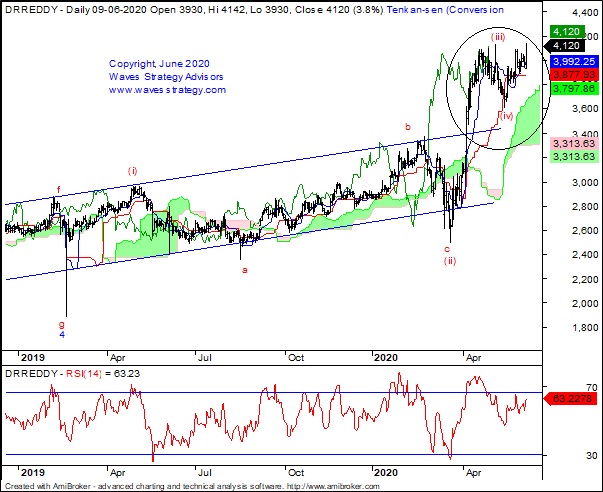
(Below is the extract of the research from our Monthly report published in April)
Elliott Wave analysis
Dr. Reddy is now moving higher in the form of wave iii of (5) and therefore we are seeing near vertical rise. Prices have actually broken above the channel resistance and can continue to move towards the previous peak. We expect wave (5) to continue at least towards … levels.
Ichimoku Cloud: We can clearly see that whenever the stock has moved either above or below the Ichimoku cloud there has been months of trending move in that direction. The same can be witnessed even now. Post breaking above prices retested the weekly cloud and is now moving higher in near vertical rise.
In a nutshell, Dr.Reddy is clearly an outperformer among the large cap pharma space and the entire sector is in very strong trending move on upside.
Happened till now – Post recommending the stock prices are moving in line in the direction of our target expectations. In today’s session the stock again hits its new 52 week high near 4190 levels. On Daily chart you can see prices still continue to follow the uptrend above the cloud in the form of wave (v).
This article is for study purpose only to view complete details research and medium term target level get access to the monthly research report – The Financial Waves monthly update
Upcoming Mentorship starting from 20th June 2020: I will be discussing all of the above methods on how to identify patterns and combine them with important indicators and Elliott wave, Neo wave theory, Hurst’s Time cycles. Only limited seats, Register now