LT: Combining Diametric Pattern with Ichimoku cloud
Jan 17, 2023
Like this Article? Share it with your friends!
We published about LT in July 2022 and predicted a possibility of good returns in the coming months in our Monthly Research report. Check out the research we had published on 2nd August itself – This stock has managed to hold its gain and gave more than 20% returns in less than 5 months of time and made a high of 2210 levels.
While trading the market it is important to understand the behaviour of the market. Using price action along with we can predict price moves in stock with high accuracy. Check out how we recently identified one such breakout in Larsen & Tourbo. You can also use these to identify stocks with momentum for short-term trades.
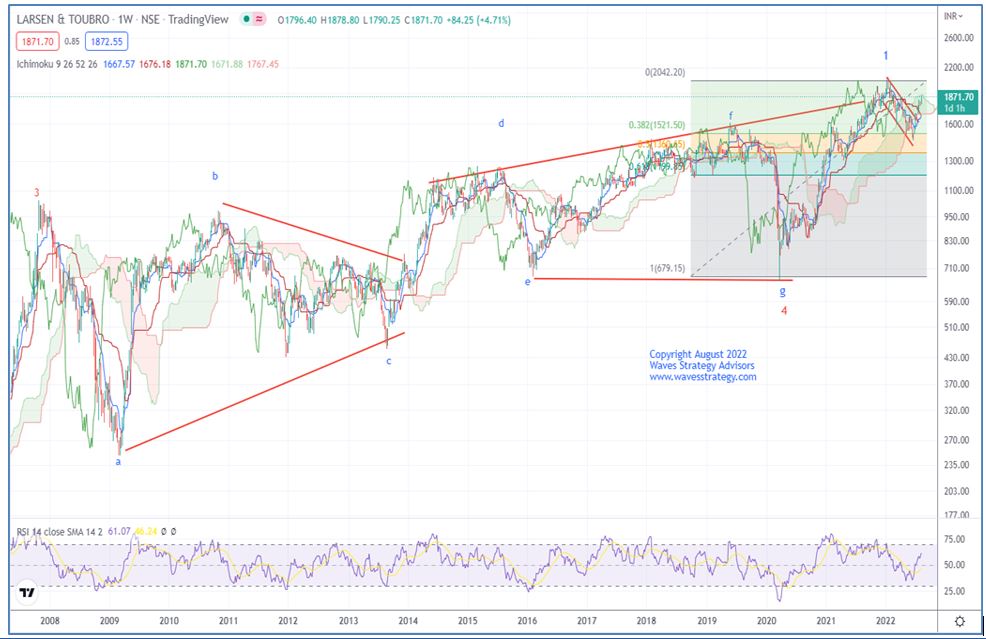
Larsen & Tourbo Weekly chart as on 2nd August 2022: (Anticipated)
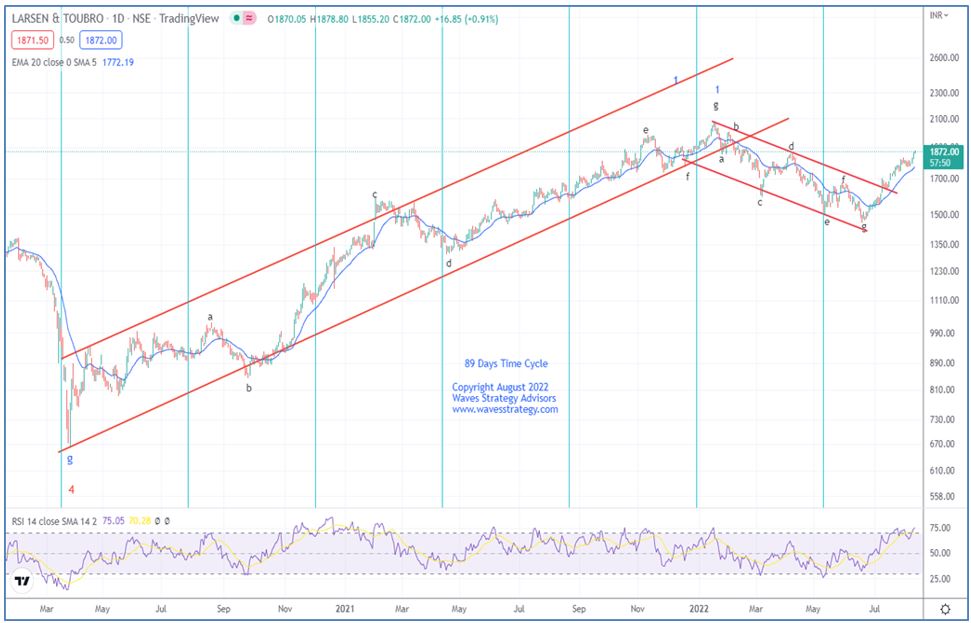
Larsen & Tourbo Daily chart as on 2nd August 2022: (Anticipated)
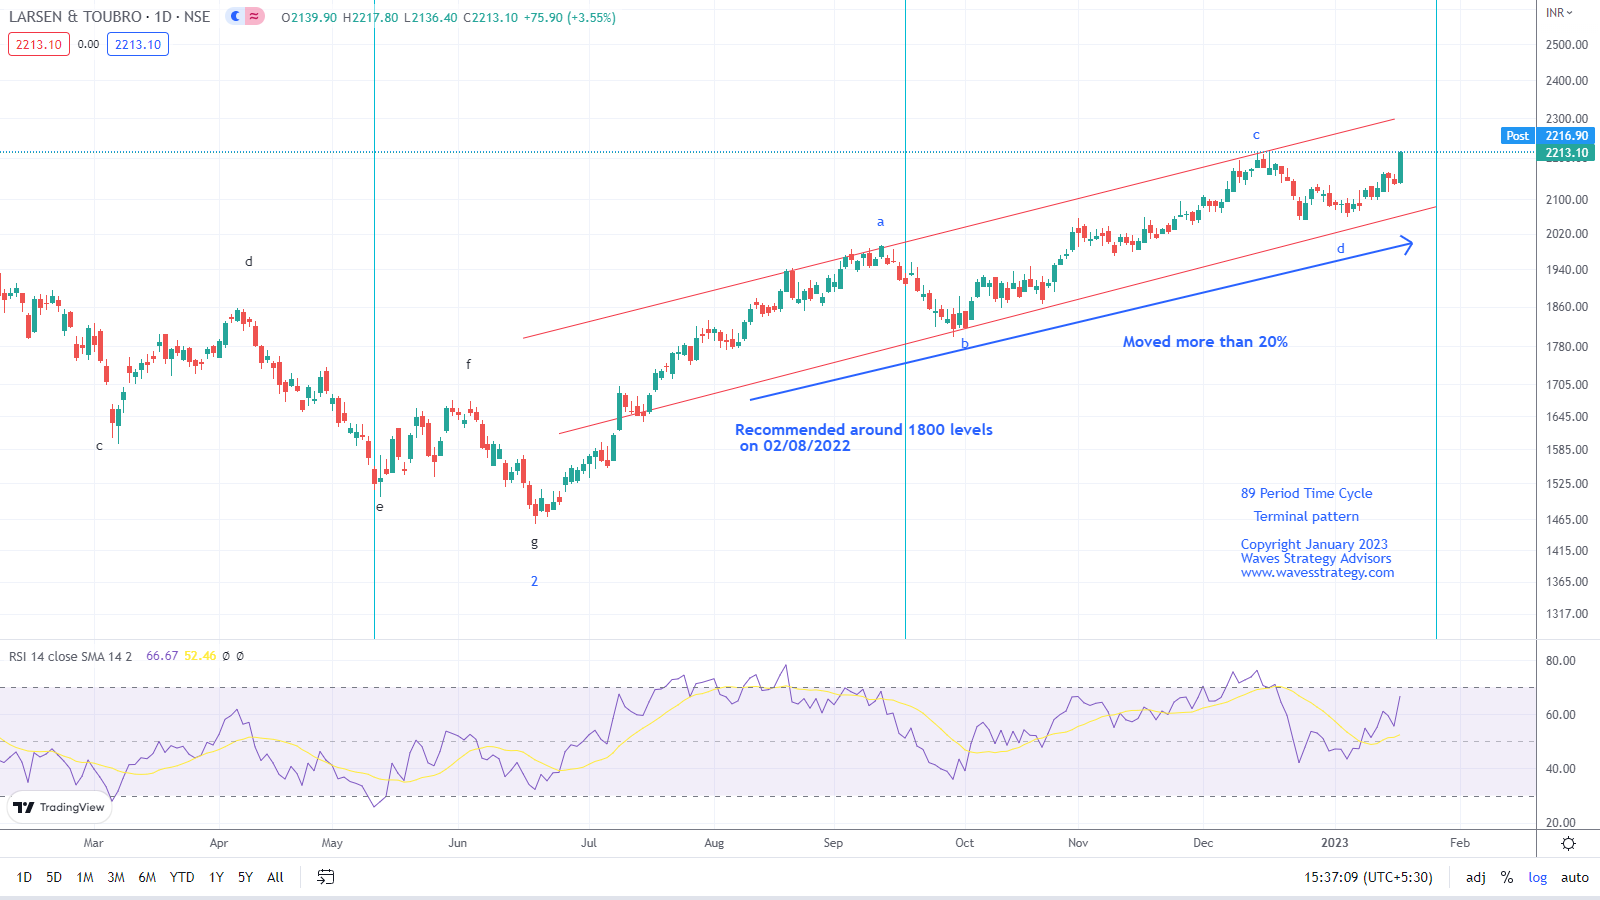
Larsen & Tourbo Weekly chart as on 17th January 2023 : (Happened)
Wave analysis as on July 2022
Larsen and Toubro are one of the important components of the capital good index which has weight age of 3.1% in Nifty. The Company is involved in the business of Engineering, construction and manufacturing. It is one of the largest and most respected Companies in India’s private sector. L&T is one of them which has been intact in a medium to long term uptrend.
On the weekly chart of Larsen & Turbo (LT), the long consolidation from 2008-2020 was in form of wave 4 in a form of bow tie Diametric pattern. From the lows near 680, prices climbed the high near 2078 levels in the year of 2022. This entire price movement completed intermediate degree wave 1. After that stocks remained under corrective mode till the mid of 2022. Bulls now have taken control again and started to rise. Prices have retraced almost 0.382% of wave 1. Since price moved below the cloud in June and moved back above it, any move above 1920 will only confirm that wave 2 has completed its course as it will break the ichimoku cloud on the upside.
Now let us come to daily chart to understand the recent trend, Intermediate wave 1 has been completed near the highs of 2078 levels and later started to move lower within the channel in the diametric fashion. Primary wave 5 is moving on the upside and forming Impulse Terminal pattern and hence internal legs were corrective in nature. Any move below 1640 will suggest that the up move was wave x and another set of correction might have started on the downside. Closest support as per the average is near 1640 levels.
The vertical lines on the daily charts are the time cycles which are used to find the important swing lows. This time cycles are used to time our entry in the trade. We can clearly see that LT tends to follow 89 Days cycle very well. Next low is likely to appear in September 2022. Till then we can expect the stock to consolidate with positive bias.
In nutshell, the short-term trend will remain positive and one can buy on dips. Whereas, any move above 1920 can confirm conversion of upside reversal. Whereas any move below 1600 will indicate that correction is still ongoing.
Happened
When we had recommended the stock, when it was trading near 1800 levels and since then prices moved more than 20% in 5 months of span. Prices made a low near our cycle and after breaking the swing high which was near 1900 a good rally was witnessed.
Currently, wave 3 is unfolding on the upside which is considered as the strongest one. All eyes are on an 89-period cycle which is due later this month.
Mentorship on Timing the Market – To create the passive source of Income, achieve financial freedom and trade with an edge with consistency by leveraging options learn the science of Time which will be the focus for Mentorship March 2023, Fill the form below for more details: