ICICI Bank Stock Alert: 28-Day Time Cycle Now in Action
Mar 23, 2026
Most traders grow up hearing that timing the market is impossible. However, Time Cycle analysis proves otherwise. Markets move in rhythmic cycles, and these cycles often repeat with remarkable consistency across instruments and timeframes.
When price action aligns with a predefined time window, the probability of early reversals increases significantly often before momentum indicators or breakout traders react.
See the detailed research below on ICICIBANK and how Time cycle on it has worked out perfectly.
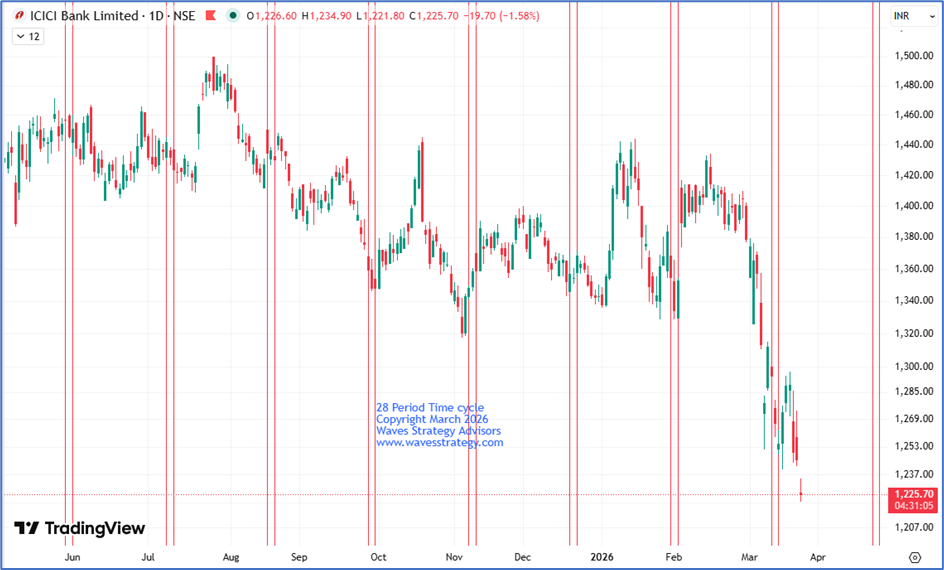
ICICI Bank Daily chart with 28 Day’s Time cycle
Why Time Cycles Improve Timing Accuracy
When price structure aligns with Time Cycle analysis, it creates a powerful decision-making framework:
- Filters out short-term noise
- Improves entry timing
- Allows controlled risk with higher reward potential
Rather than chasing momentum, traders can position themselves ahead of the crowd, near potential inflection points.
Time and Price Alignment: A High-Probability Trading Framework
- The Time cycle has shifted to the sell side, indicating bearish momentum. Price has broken below the cycle low of 13th March 2026 (1240 levels)
- This breakdown signals continued selling pressure in the near term. Downtrend is likely to persist unless key resistance is reclaimed
- A decisive move above 1300 levels is required to negate the bearish view.
The Time cycles do not guarantee outcomes, when combined with price action, they help in identifying potential turning points early and provide a structured trading perspective.
Conclusion:
- The overall structure of the stock continues to reflect a bearish bias, indicating that selling pressure is still dominant in the market.
- If the current momentum persists, the stock is likely to move towards the 1195–1200 support zone in the near term.
For now, overall trend for the stock remains on the side of bears as long as we do not see a reversal as per 3 candlestick rules downside move to near term support levels of 1195-1200 can be seen. The bearish view can continue unless a strong reversal backed by price action is observed, signaling a potential shift in trend.
Brahmastra (Mentorship on Timing the market) -
Learn to time the market to the very Day, Hour and Minute by combining the concepts of Hurst’s Time cycle on Index and stocks as well, Gann square of 9, Elliott wave, Neo wave and be a part of elite trader’s community who are Time Traders.
Fill the form now
3 Months of TRISHUL Membership (Options Mantra+ Elliott Wave+ Neo Wave)
Trishul Membership – Options Trading with Elliott wave, Neo wave, Ichimoku cloud, and sacred science of trading & forecasting is covered in the Options Mantra Live Sessions - 11th - 12th April & Sutra of Waves Live Session - 9th - 10th May 2026. Limited seats available.