Indian Hotels - Identifying bottoms using Time Cycle
Mar 28, 2022
Like this Article? Share it with your friends!
Hotels sectors have been showing good movement from the past few trading sessions. Time cycles is a simple yet very effective way to time the market to the very Day, Hour or Minute.
Indian Hotels is a classic example that shows how Time Cycles can help in capturing the turn to make a quick short-term trade.
Indian Hotels Daily chart with 57 Days’ Time Cycle
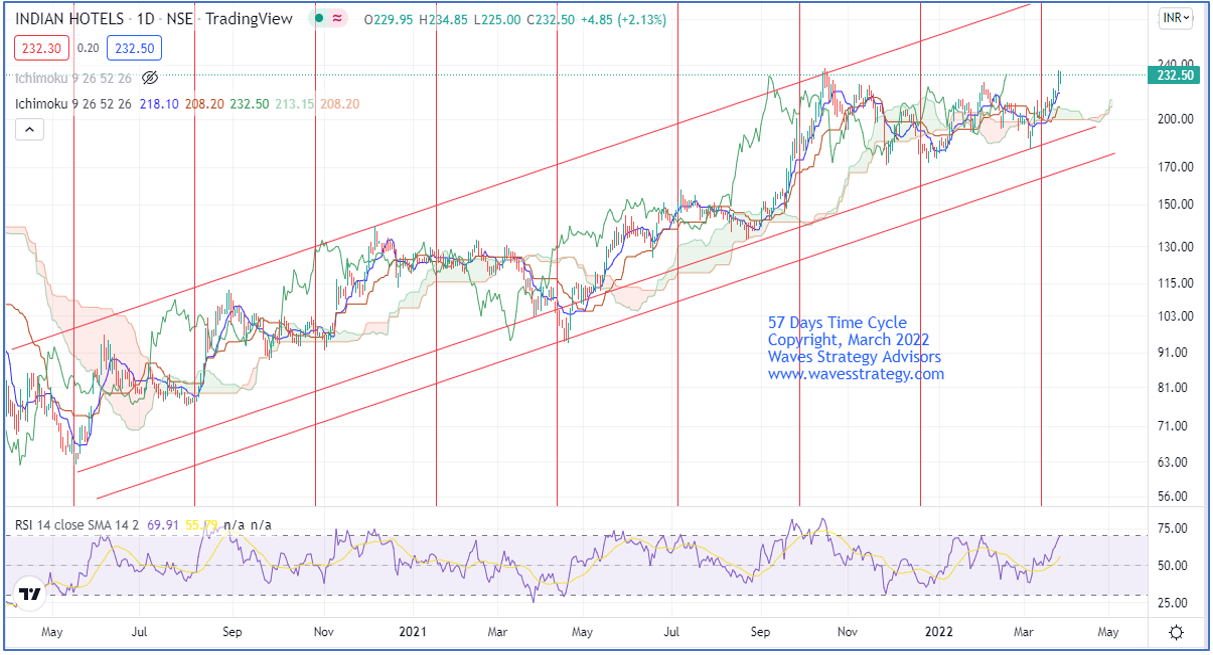
In the above daily chart of Indian Hotels, we can see that the vertical lines plotted are of the 57-day Time Cycle where important lows have been forming since May 2020. Notice how after every 57 days near the vertical line an important low is formed with a slight variation of two to three bars. Now the stock has recently formed a time cycle low on 14th March 2022 and since then the stock has been moving in an uptrend.
The stock has been moving well within the rising channel. The prices are now near its 52 weeks high. Prices tend to move much higher after the 52 weeks high is taken out or the next time prices approach the support level of the channel.
This is a simple way by which one can combine Time Cycles along with Candlestick patterns and other technical indicators to identify a high accuracy trade setup.
3 months of Mentorship on Timing the Market – Be a part of the Elite #TimeTraders and you will be transformed as a trader. Learn the risk management, money management strategy with algo creation, stock selection, complete trade plan using Elliott wave, Neo wave, Time cycles and handholding with exclusive access to webinars for lifetime. Fill out the form below for more