
INDIGO Near 4500: The Next Move Could Be Crucial!
Oct 23, 2026
The Gann Square of 9 is a simple yet powerful tool for identifying key support and resistance levels, based on the principle that price moves in mathematical harmony. Certain levels act as magnets until they are decisively broken. Lets understand how Gann and KSt set up combine dis working on InterGlobe Aviation Ltd.
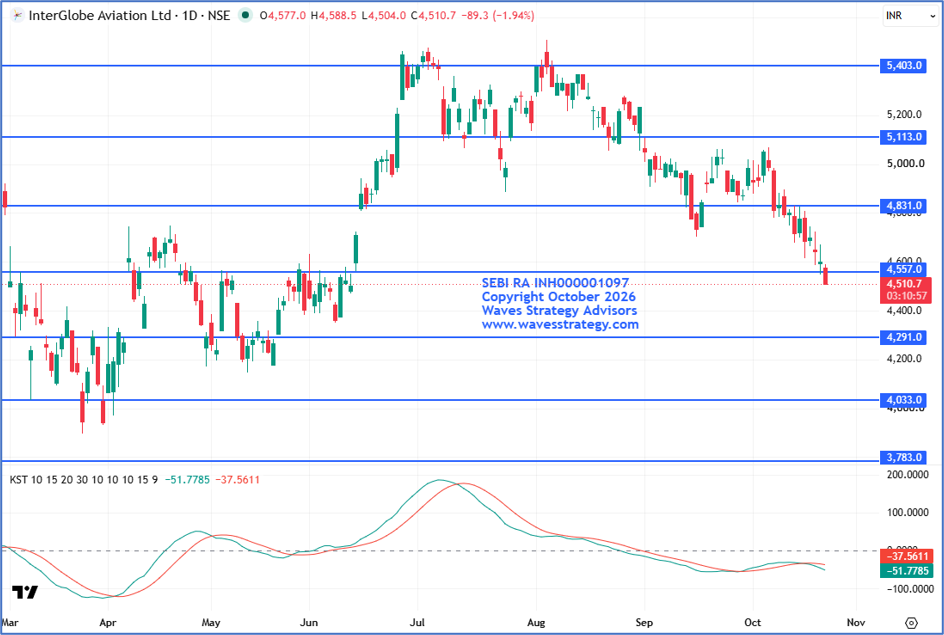
INDIGO Daily chart with Gann Levels and KST Indicator
Gann and Price Action analysis
- On the daily chart INDIGO Ltd. has been witnessing sustained selling pressure since the beginning of August 2026 forming a series of lower highs and lower lows. This indicates a bearish price structure.
- In today's session the stock declined by nearly 1.94% to 4510.70 and slipped below the important Gann level of 4557 indicating continued weakness.
- Prices are currently trading below 4557 making this level an important zone to watch. A sustained move below 4500 could intensify selling pressure and drag the stock towards the next Gann support at 4291.
- If 4291 is decisively breached the next downside reference is the Gann level near 4033.
- On the upside 4740 is the immediate level to reclaim. A sustained move above it could provide some relief.
KST Indicator
- The Know Sure Thing (KST) is a momentum-based indicator that helps assess the strength and direction of price momentum.
- When the KST line crosses below its signal line it indicates weakening momentum and can provide an early warning of a potential bearish shift.
- A KST reading below the zero line indicates that momentum remains negative.
- On the current chart the KST line is below the signal line and both are trading below the zero-line indicating continued weakness in momentum.
Conclusion
- The combination of Gann levels price action and the KST indicator suggest that INDIGO remains under bearish pressure.
- A sustained move below 4500 could drag prices towards the next Gann support at 4291 followed by 4033 if selling pressure persists.
- On the upside 4740 remains the immediate level to reclaim. A sustained move above this zone could provide initial relief but further confirmation from price action would be required to signal a meaningful recovery.
Learn Advanced Technical Analysis with Brahmastra
Brahmastra — Technical Analysis Mentorship
Learn the science of trading with algo creation, stock selection, options trading, Elliott Wave and Neowave.
In the Brahmastra sessions, you will learn how these concepts can be combined to develop a structured approach to market analysis and trading. Fill below form for more details: