INGERRAND Stocks - Price Patterns with powerful Indicators
Mar 30, 2022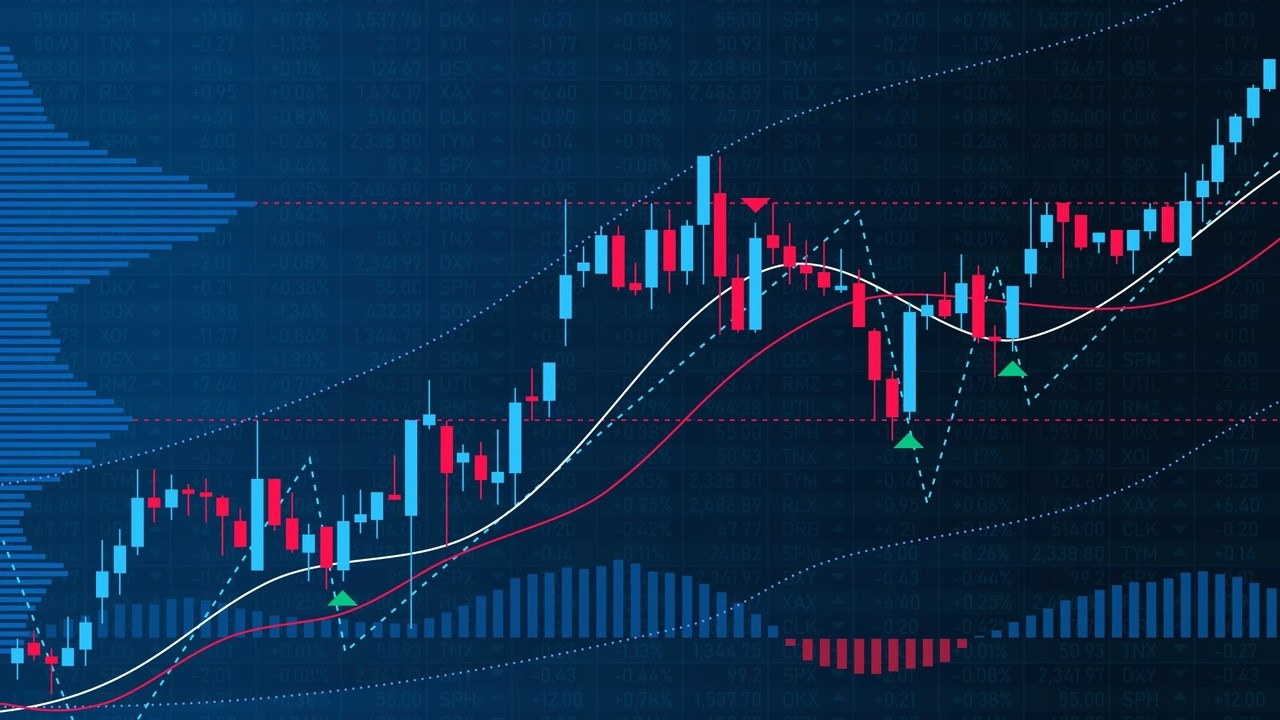
Like this Article? Share it with your friends!
Using indicators along with price action techniques gives better confirmation and increases the accuracy of the analysis. We have shown here how we have analysed INGERRAND stock using price action and indicators – Ichimoku Cloud.
Ichimoku cloud - The Ichimoku Cloud is a technical tool that indicate the support and resistance, identifies trend direction, gauges momentum and provides trading signals.
Today morning we published INGERRAND in "The Financial Waves Short Term Update" which our subscribers receive pre-market every day. Check out below the detailed research report that we published.
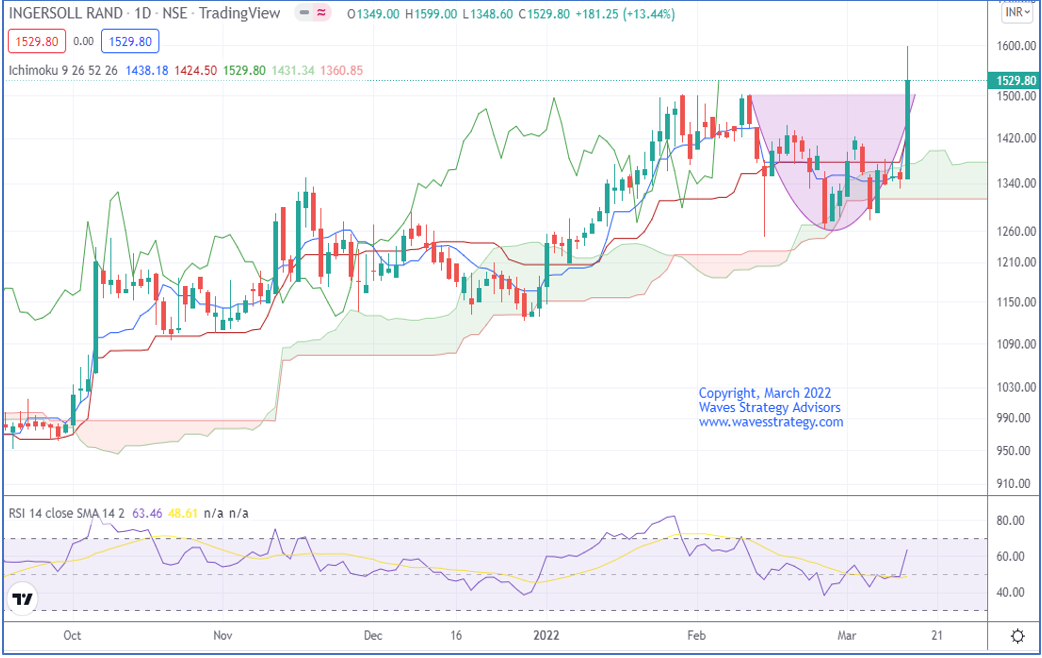
INGERRAND as on 15th March 2022 (anticipated)
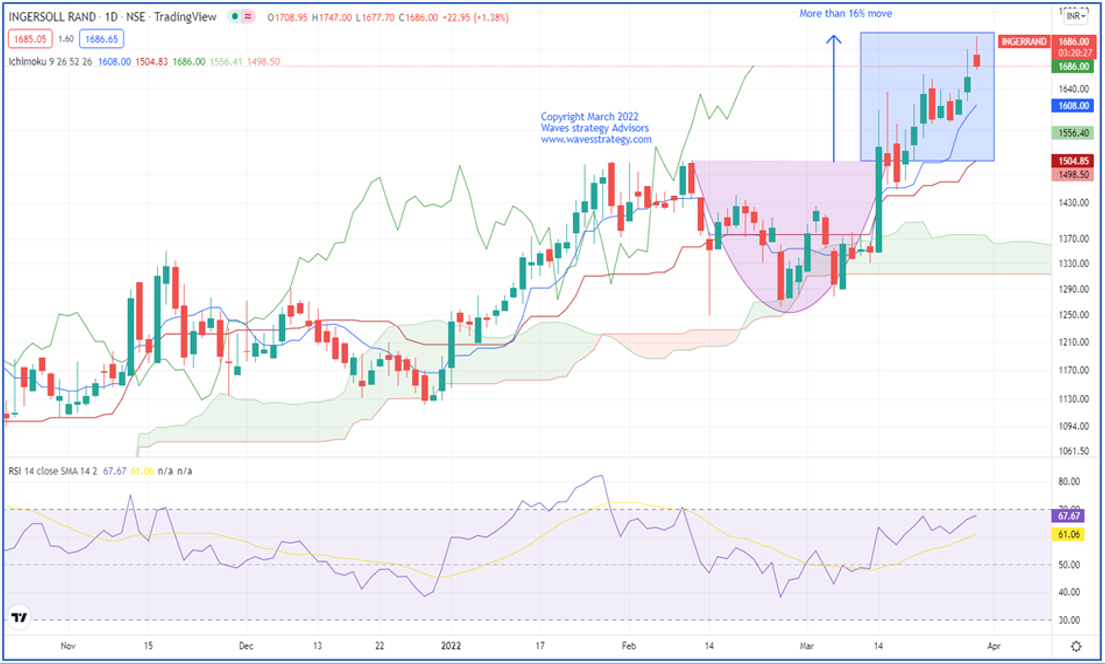
INGERRAND as on 30th March 2022 (happened)
Wave analysis as on 15th March 2022
On the daily chart, in the previous session prices formed a bullish candle. Price has closed above 1502 levels which confirms breakout of rounding bottom pattern. Price has recently bounced from the Ichimoku cloud which can act as near-term support zone.
In short, the trend for this stock is positive. Use dips towards 1490-1500 as buying opportunity for a move towards 1690-1700 levels as long as 1440 holds on the downside.
Happened: Stock moved precisely as expected. The price took support from the conversion line (Blue) of Ichimoku cloud and continued to move higher. The stock has gained more than 16% from the dip levels and achieved a new lifetime high of 1547 levels.
3 months of Mentorship on Timing the Market Starting from tomorrow – Be a part of the Elite #TimeTraders and you will be transformed as a trader. Learn the risk management, money management strategy with algo creation, stock selection, complete trade plan using Elliott wave, Neo wave, Time cycles and handholding with exclusive access to webinars for lifetime. Fill out the form below for more