ITC – Identifying bottoms using Time Cycle.
Oct 14, 2021
Like this Article? Share it with your friends!
ITC has shown a sharp rise. In such cases, one can take advantage of advanced technical tools like Time Cycles. Check out the Analysis below on how one can trade the stock at current levels.
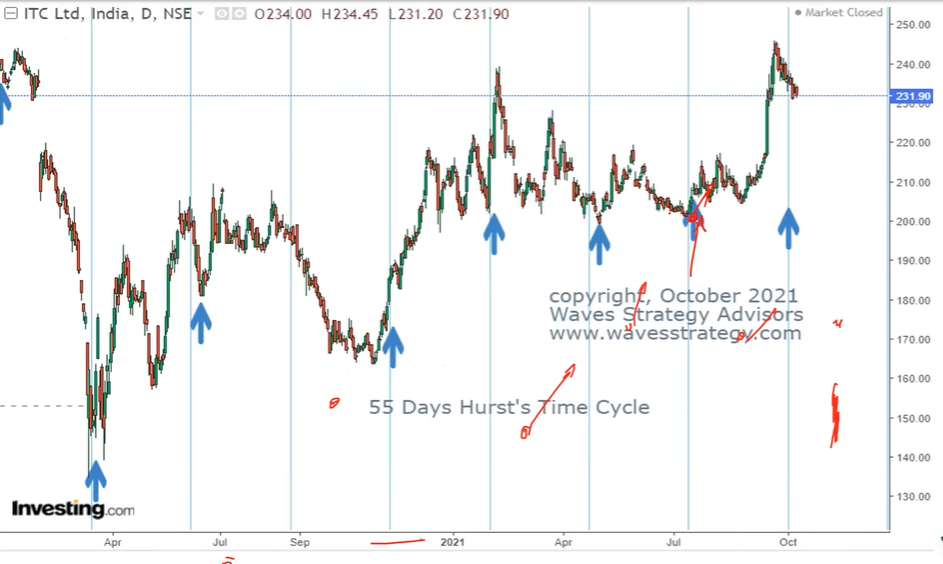
ITC as of 09th October 2021 (Anticipated)

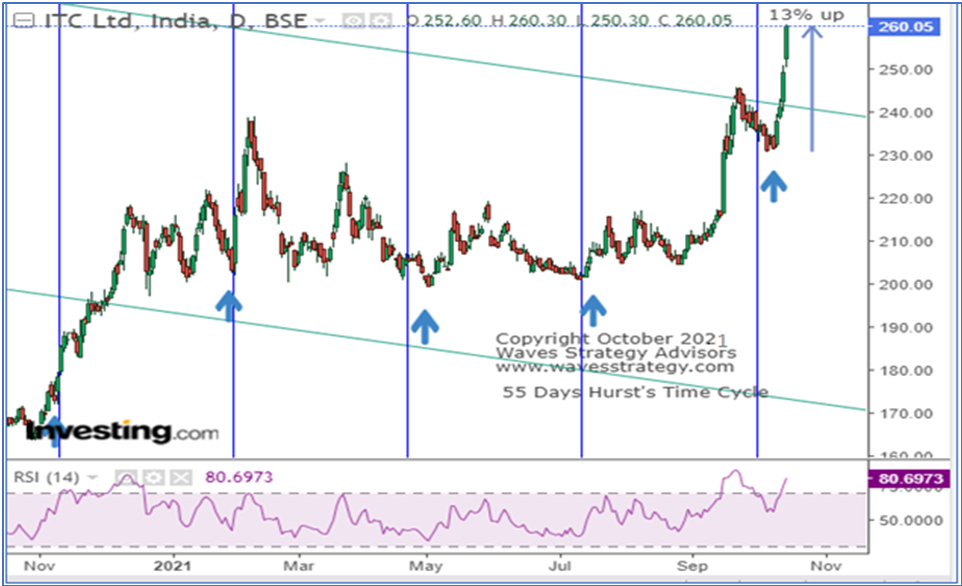
ITC as of 14th October 2021 (Happened)

Analysis –
We recently conducted an online seminar Masters of Cycle (MOC) on 09 October 2021, wherein we have discussed the application of time cycles on various stocks. One of the stocks we discussed was ITC.
We have posted the screenshot of the ITC daily chart from the seminar above. Wherein, the vertical line represents Time Cycle which is applied to catch the crucial lows and also to finds its reversals. On ITC, we had applied the 55 Days Hurst Time cycle as it helping us to capture the major lows.
We have also mentioned that the reversals can only be witnessed after a bullish candle is formed. Prices moved exactly as we expected and made the high of 260.3. The total movement on the upside is 13%.
3 Months Mentorship on Timing the Markets - Learn to time the market and trade with me for the period of 3 Months including Live trading, stock selection, Momentum, and Multibagger stock identification, Timing the entry to the very Day, Hour, and Minute using Time cycles and Elliott Wave analysis. Early Bird ends on 25th October 2021. Get access to MOC as soon as you register for Mentorship, Contact +919920422202 for more details
