ITC - Path Ahead using Time Cycles.
May 06, 2025
Time Cycle is a Technical Analysis study and it is surprising that such concepts can help to time the market and catch early reversals which improves decision making of the traders.
J.M. Hurst defined that there are standard cycles that exists and it is possible to identify the actual cycles on the stock market.
ITC Daily chart with 55 Days’ Time Cycle.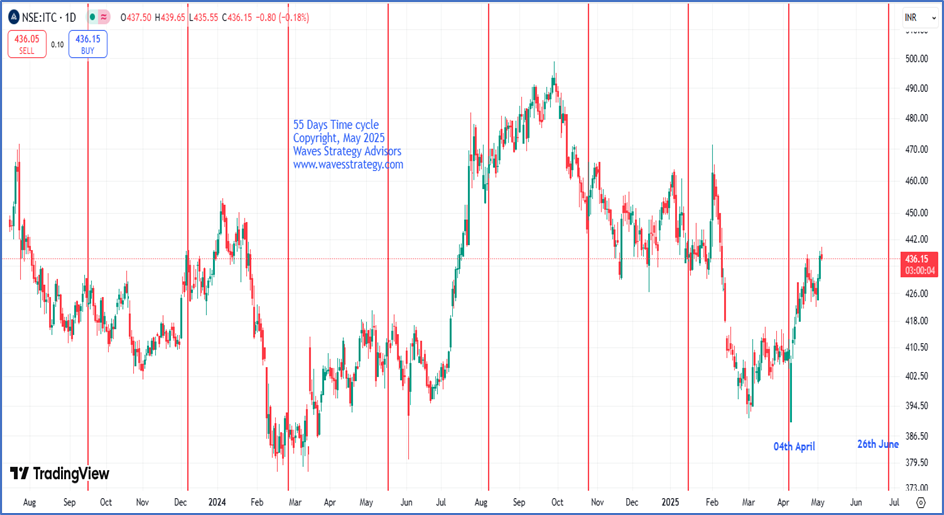 We have applied 55-period cycle on the daily chart and we can observe how prices have been following our plotted cycle. Recently, prices formed a low of 406 levels near cycle zone i.e. due on 4th April. Since then, prices have gained more than 12% in a short span of time which was in sync with our expectations. Along with this, cycle turned on the buy side by breaking above its previous swing high of 416 levels. For now, the next cycle is due on 26th June till then we expect the cycle low of 406 levels to be protected on the downside.
In a nutshell, the time cycle for ITC has turned on the buy side. Follow up buying can boost bullish momentum towards 450 followed by 470 levels. On the downside, a break below 406 levels will a sight of concern.
Above research shows power of Time trading and one need to not worry about not missing out the trend as when time is in favour, then we can catch moves well in advance if price action confirms.
Brahmastra (Mentorship) on Timing the market - Equip yourself with tools of Elliott wave, Neo wave, Time cycle, stock selection algo creation, multibagger and momentum stocks identification along with exact trade setup that actually works. Only a few seats left! Fill below form for more details