JSW Steel: Identified the Up move using ADX, Channels, Diametric pattern
Dec 02, 2020JSW steel has been moving precisely as per channel and Neo wave Diametric patterns. In addition to that ADX indicator also suggested the up move. Read below the detailed explanation on indicators and wave patterns.
Average Directional Index (ADX) ADX indicator measures the strength of the trend. This indicator rises during a strong trending move irrespective of whether the trending move is on upside or downside, whereas a non trending move results into lower reading on ADX.
Look at the below chart of JSW Steel published in the equity research report on 26th November morning before markets opened – The Financial Waves short term update
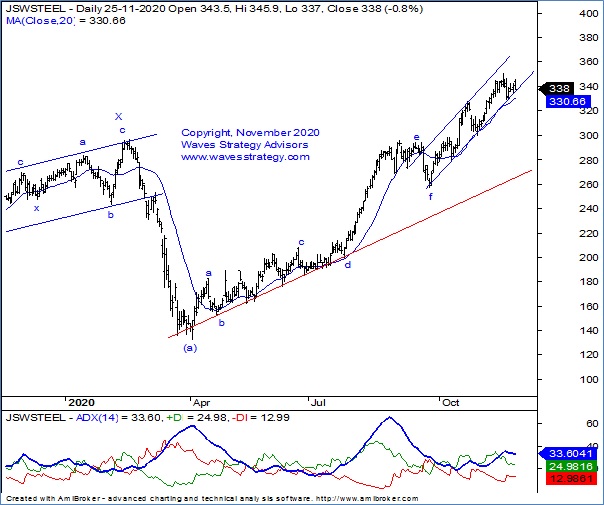
JSW Steel Daily chart: (Anticipated as on 26th November 2020)
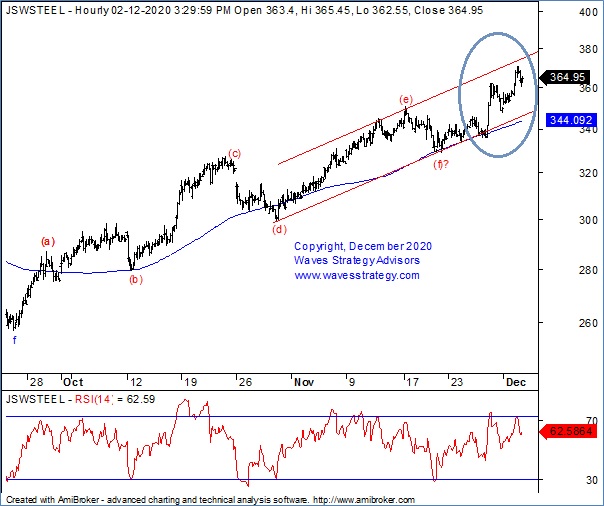
JSW Steel Hourly chart: (Happened as of now)
 Wave Analysis: Following was mentioned on 20th July when the stock was near 338 levels.
As shown daily chart, we have shown ADX indicator on the daily chart which shows the strength of the trend. ADX is seen rising indicating strong momentum. We can see +DI is above –DI and ADX is quoting near 33 indicating strong positive momentum in the trend. One can stay bullish as long as 329 remain intact on downside. As per wave counts wave (b) seems to be forming Diametric pattern wherein wave g is unfolding on upside.
ADX is normally calculated using positive Directional Movement index (+DMI) and negative Directional movement index (-DMI) and the average of the difference of this indicators form ADX. In simple terms, it measures the strength of positive bar formation over negative bars over the given period of time.
On Hourly chart, 110-day period Exponential Moving Average is acting as a brilliant support line and it has provided support at regular intervals. As well as prices are taking support from lower trend line of channel support. This suggest that one should be in the direction of the ongoing trend as far as this line is protected and any pullback towards the same should be utilized as buying opportunity.
In short, JSW STEEL seems to be sideways. A break above 345 can take price towards 355 or higher levels as long as 334 remain intact on downside
Happened: JSW Steel has showed precise movement as expected and signalled by ADX and Wave counts. These levels were forecasted weeks ago even before its happening using basic and advance technical methods applied across daily and hourly time frames as you can see in above research.
To know the next trending moves subscribe to “The Financial Waves Short Term Update” which covers Nifty and 3 stocks with in-depth research using Elliott wave. You can subscribe in less than 2 minutes over here
You can subscribe to our Intraday/ Positional calls advisory and get free daily equity research report along with it. See the details here
Learn the power of Elliott & Neo wave and equip yourself with tools and indicators of technical analysis in the upcoming Online Become Market Wizard which is subdivided into two modules- MOTA and MOW Know more here. Early bird offer end on 12th December 2020 Hurry up!!!