How the 29-Day Time Cycle Predicted Rally in Laurus Labs
Jun 23, 2026
Price tells us where the market is headed, but Time tells us when the move is likely to unfold. Combining Elliott Wave and Time Cycles helps traders anticipate high-probability market turning points.
Look at the below chart of Laurus Labs Ltd with the Time cycle applied on the daily time frame chart that was anticipated on 22nd June 2026 in our Vayu report
Laurus Labs Ltd Daily chart with Time cycle and Elliott wave Anticipated as on 22nd June 2026
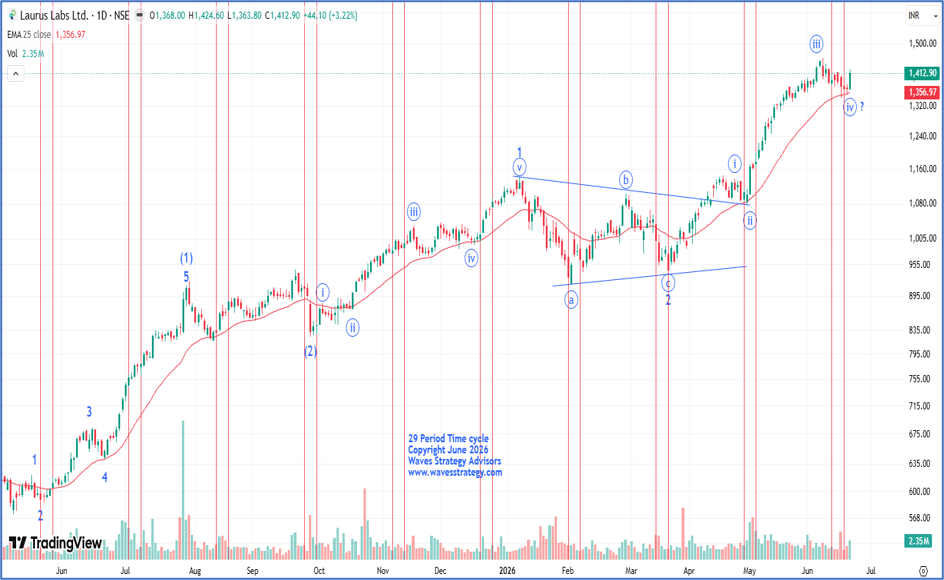
Anticipated as on 22nd June 2026
LAURUSLABS outperformed the Nifty Index, by gaining more than 3% in the previous session, while the Nifty Index declined by nearly -1% highlighting the strength and outperformance of stock.
On the daily chart, LAURUSLABS has been moving up in the form of Higher High and Higher low formation since past 4 months which is positive price pattern. Also, prices took support of the 25 period EMA on 17th June 2026 near the 1350 level and has bounced back on the upside indicating the significance of it.
As per wave perspective, the stock has been following the classic Elliott wave pattern since June 2025. Currently, intermediate wave 3 of primary degree (3) is ongoing on the upside which is further subdividing. In which, internal wave iv in circle is near completion and for confirmation about the same follow up buying is now going to be important.
29 period Time cycle -The most recent cycle zone was due on 11th June to 17th June 2026 zone. Following this phase, the prices reversed sharply on the upside and are now approaching the previous swing high of 1457 level. This level remains an important resistance zone for the asset. A breakout above the prior swing high could confirm a shift in momentum and will turn cycle on the buyside due to which further bullish move can be seen in the near term.
In a nutshell, overall trend for LAURUSLABS is on the upside as indicated by Elliott wave, Time cycle, price action. For now. a break above 1425 can push prices higher towards 1530 or higher with key support being around 1350 level which is a cycle low.
Trading strategy for futures: Long positions can be initiated once the stock futures break above the 1430 level with stoploss as 1404 and target of 1475 (One can book part tp near 1444 – 1446 and trail sl to cost)
Trading strategy for Options: Buy LAURUSLABS JUNE 1420 CE above 31, Stoploss: 24, Target 45 (one can book part tp near 35-36 and trail sl to cost).
Laurus Labs Ltd Daily chart Happened as on 23rd June 2026
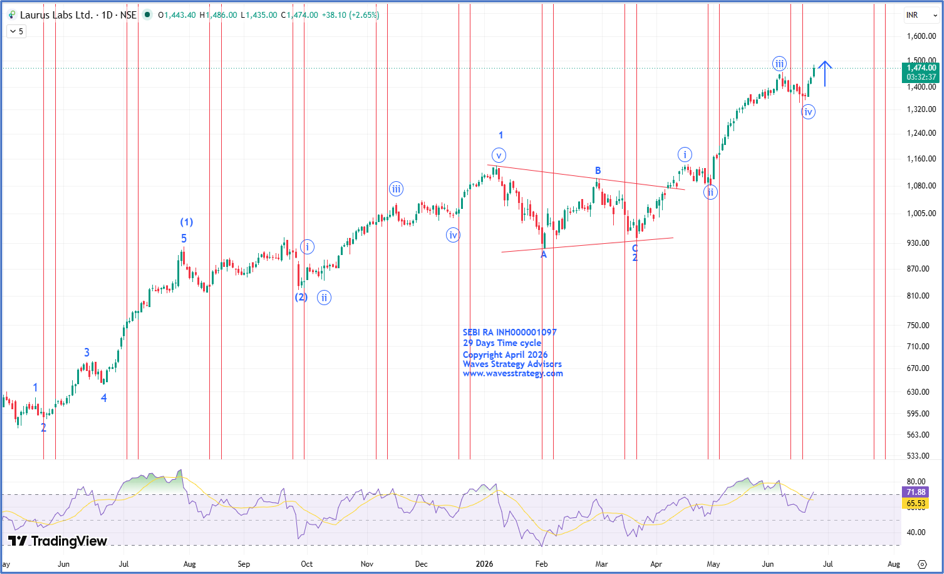
- The Pharma sector continued to witness strong buying interest, and among the stocks discussed in our research reports, Laurus Labs have emerged as one of the standout performers.
- We anticipated the stock to resume its larger uptrend as the corrective phase appeared complete and the Elliott Wave structure suggested the beginning of a fresh impulsive move.
- Laurus Labs triggered a fresh breakout above 1420, confirming our positive outlook. The stock rallied sharply post-breakout. In the Cash segment, we captured nearly 4% upside in a single trading session. While target was achieved in both the futures and options segments.
- The stock outperformed broader indices, which largely remained range-bound during the period.
In a nutshell, Elliott Wave structure continued to support the ongoing impulsive uptrend. Time Cycles and Price Action remained aligned with the bullish view. The broader trend remains buy on dips as long as 1360 holds on the downside. Our projected upside target of 1500 remains active.
Want to know more about such stocks like Laurus Lab Ltd. Subscribe to our Vayu Short-Term Update: Get a list of stocks with high growth potential: Check Here
Brahmastra Mentorship – Advanced Market Timing
Time the market to the very day, hour, and minute using a powerful combination of:
- Elliott Wave & NeoWave
- Hearst Time Cycle Analysis
- Stock Selection Algorithm
- Practical Risk & Money Management
Fill the form below to know more