
Is Laurus Labs the Next Breakout Stock? Elliott Wave Reveals the Opportunity!
Jul 09, 2026
Elliott Wave Theory provides a structured approach to understand market trend direction and maturity and when wave counts align with Time cycle, it strengthens conviction and improves the probability of capturing meaningful price moves. The combination of both can help traders improve timing and identify precise entry and exit opportunities.
Laurus Labs Ltd Daily chart with Elliott wave and 29 Period Time Cycle
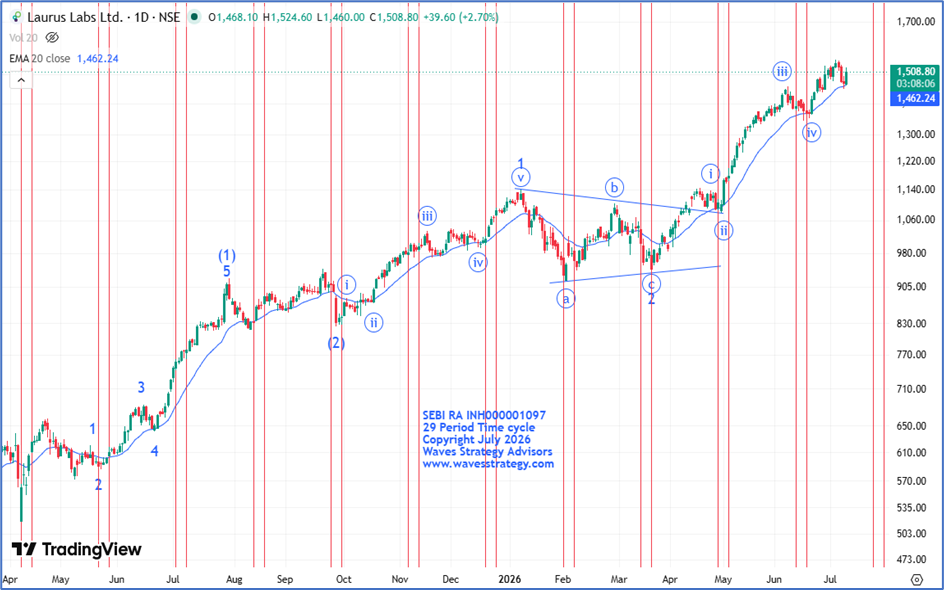
Elliot wave analysis
- The stock is following classic Elliott wave pattern since the beginning of April 2025.
- Also, since 19th March 2026 the stock is under Primary wave 3 in which wave (iv) looks to have been completed on the downside in June 2026 and now the rise is in the form of wave (v) of 3.
29 Period Time cycle with 20 EMA
- The stock is also following the 29 period Time cycle in which the most recent cycle was on 17th June 2026 and since then the stock has almost surged by 15% highlighting the significance of it.
- Also, on 8th July 2026 prices tested 20 period EMA and showed sharp bounce on the upside from it, i.e., nearly 6% from it, reinforcing reliability on 20 period EMA support level.
Conclusion
- The combination of Elliott Wave structure, Time cycle and EMA 20 confirmation suggest a strong technical setup.
- For now, one can go long once stock breaks above prior swing highe., near 1530 level as long as 1445 levels remain protected on the downside.
Learn Time Cycle Trading Through Brahmastra Mentorship
The Brahmastra Mentorship Program is designed for serious traders and investors who want to learn professional market trading techniques.
The program covers:
- Time Cycle Trading
- Elliott Wave & NeoWave Analysis
- Stock Selection Frameworks
- Algo-Based Market Strategies
- Risk Management and Trading Psychology
Limited seats are available.
Fill out the form below to learn more and become part of this transformational trading journey.