
LODHA: A Powerful Elliott Wave & AK Indicator Setup!
Oct 21, 2026
Elliot Wave when combined with AK Indicator, helps create high-probability trade setups with greater accuracy by aligning price structure, allowing traders to identify stronger entries, better risk control, and more reliable market movement.
Check out the research below on LODHA we had earlier covered this stock in our Vayu report dated 12th October 2026.
Lodha Developers Ltd Daily chart: Anticipated as on 12th October 2026
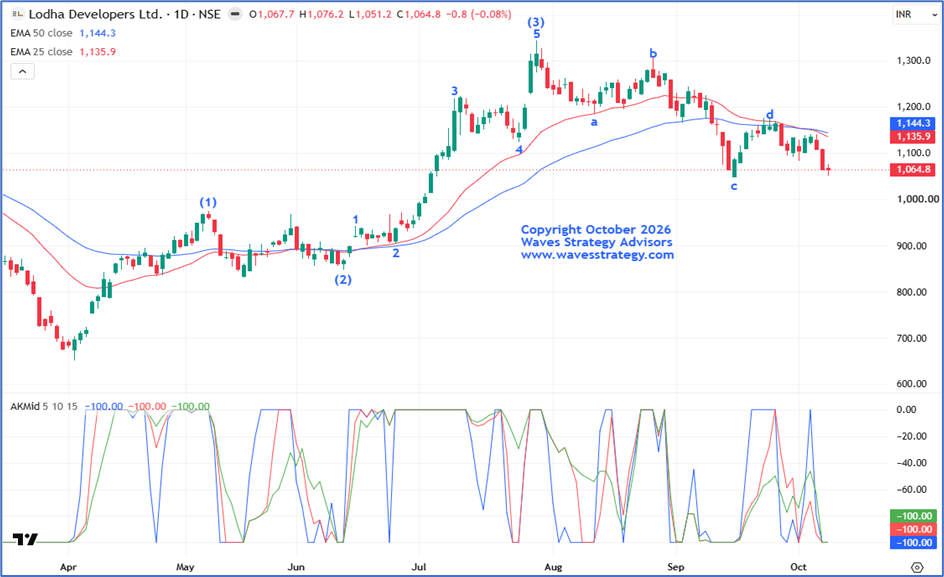
Anticipated as on 12th October 2026
In the previous week, Lodha Developers Ltd. declined nearly -4% and closed below the previous week's low, which is a negative sign. This indicates strong selling pressure at higher levels.
On the daily chart, 25 period EMA line (red) crossed below the 50 period EMA line (blue) on 6th October 2026, indicating a negative shift in the stock direction and increasing selling strength. If the price manages to sustain below this crossover, further downside movement can be expected in the upcoming trading sessions.
Also, since past 3 trading sessions every candle has closed below its prior day’s low, indicating continued selling interest in the stock. Along with that, stock has respected Dow Theory, as prices consistently formed lower highs and lower lows since past 3 month which suggests stock is in downtrend.
On AK indicator we can observe that all 3 lines of the AK indicator are on the -100 which indicates short side momentum is developing.
As per wave perspective, the stock has been following Elliott wave pattern since April 2026. Currently, wave e of primary wave 4 is ongoing on the downside in the form of diametric pattern.
In a nutshell, overall trend for Lodha Developers Ltd. is on the side of bears as indicated by price action and technical indicator. For now, one can use sell on rise approach for a move towards 1000. On the upside 1130 can act as a strong resistance level.
Trading strategy for Futures: Short position can be initiated once stock futures pullback towards 1085 - 1075 with stoploss of 1106 and target of 1025 level (one can book part tp 1060 – 1050 and trail sl to cost).
Trading strategy for Options: Buy LODHA OCT 1100 PE once the stock future pullback towards 1085 - 1075 and for risk reward as per future strategy.
Lodha Developers Ltd Daily chart: Happened as on 21st October 2026
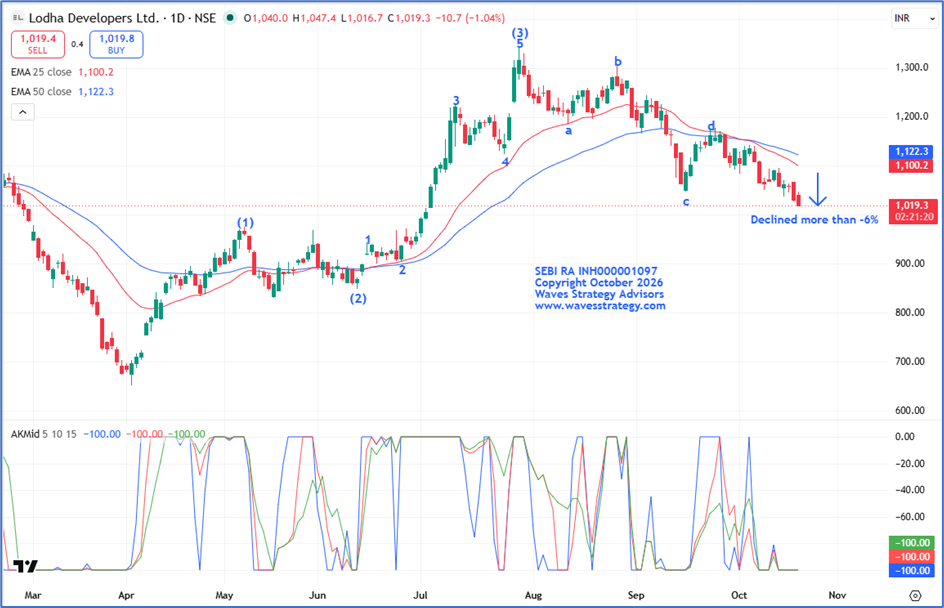
Happened as on 21st October 2026
- Post pullback towards the 1085 level prices showed a strong move on the downside forming Lower High and Lower Low Since then, the stock has declined more than -6% which is a negative sign.
- Currently, Primary Wave (4) is in progress in the form of a diametric pattern indicating a downside move
- In which wave e is currently unfolding.
- The custom AK Indicator is still on the downside, reinforcing the bearish setup.
Conclusion
- The combination of Elliot Wave structure, price action and AK indicator suggests the trend is on downside.
- A decisive move below 1015 may trigger the next leg of the rally.
- 1070 remains a crucial support level to watch in the near term.
Learn Advanced Technical Analysis with Brahmastra
Brahmastra — Technical Analysis Mentorship
Learn the science of trading with algo creation, stock selection, options trading, Elliott Wave and Neowave.
In the Brahmastra sessions, you will learn how these concepts can be combined to develop a structured approach to market analysis and trading. Fill below form for more details: