Crude Oil: How to identify precise targets using Elliott Wave theory and Time cycles.
Sep 05, 2023
It’s possible to forecast almost precise targets months in advance using Neo waves and Time cycles. Check for yourself how we analysed such move in Crude Oil a month ago.
The following research on crude oil was published in “The Financial Waves Monthly Update” on 14TH August 2023.
MCX Crude Oil Weekly chart (As of 14TH August 2023) 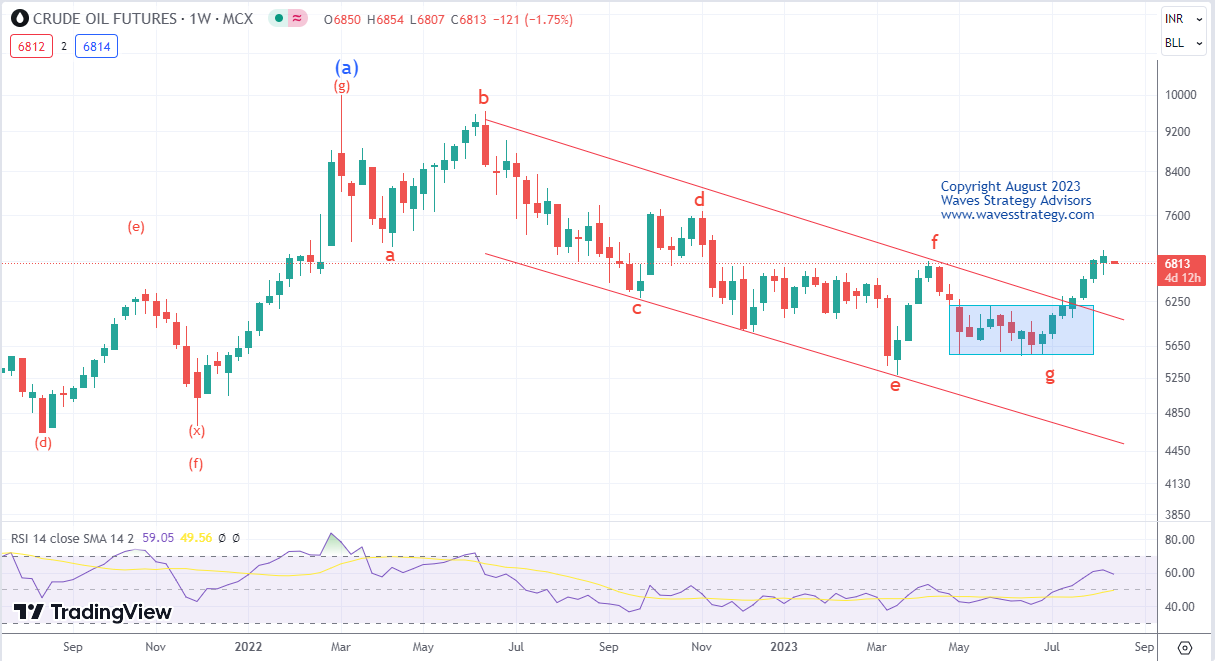
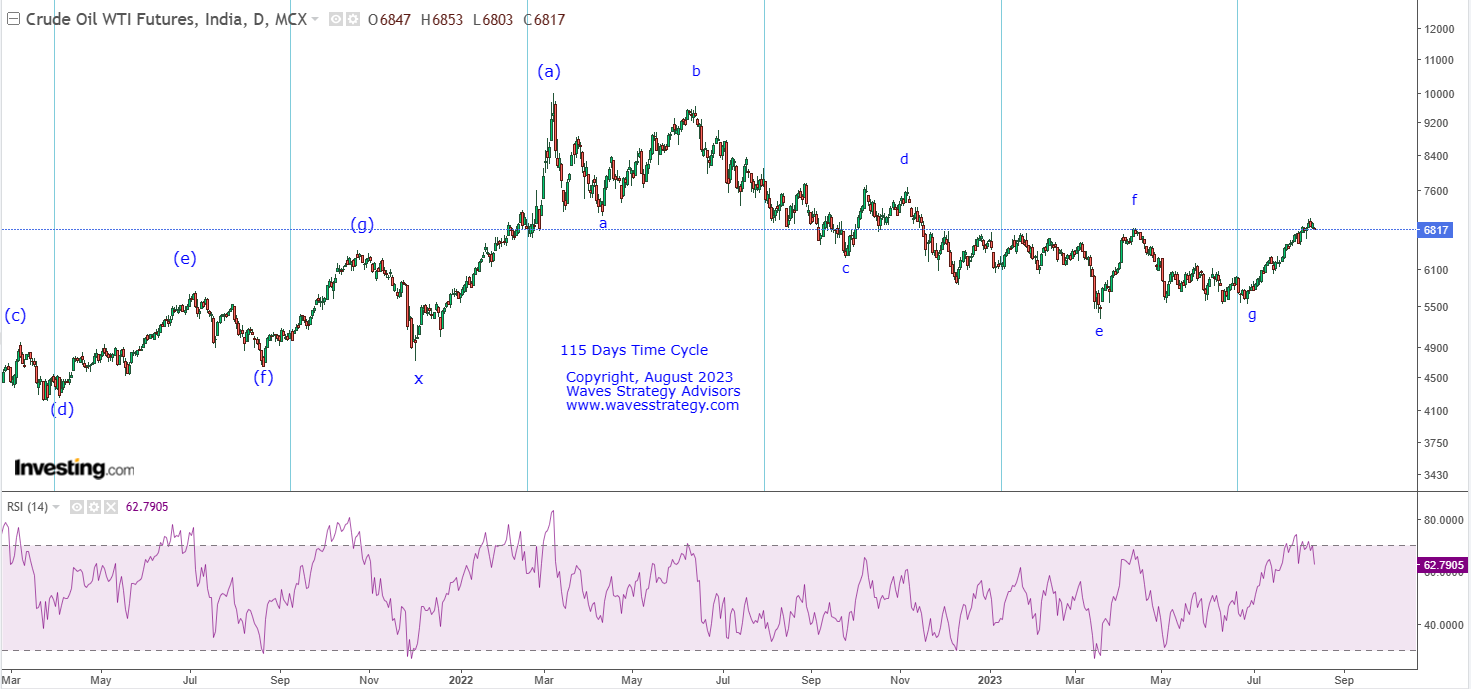
MCX Crude Oil 115 Days’ Time cycle (As of 14TH August 2023)
Wave analysis as on 14TH August 2023.
Crude is trading near the three-month high due to tightening of Global supply and strong demand in countries likes US. So, prices can continue to surge higher in coming months. Since December 2022, MCX Crude Oil was moving in a consolidation. Prices recently gave breakout of the consolidation and till date managed to stay above it. Let us understand view for MCX Crude for coming months.
Crude Oil weekly chart: -We used the bar technique approach on the weekly chart. As we can see, prices have not closed below the preceding week’s low since the beginning of July, which is a positive indication. Crude is currently trading near its swing high which is near of 6805 levels. If the price closes above its swing high, then it will be a good indicator for this asset. Because of this surge, the price was able to break out of its Multi month range of 6200-5550. Also, the prices, which was previously trading in a downward sloping channel, has broken out of it and is now trading above it.
Time Cycle: - 115 period time cycle is working well on the daily chart of this commodity. This Cycle has been working exceptionally well in order to catch lows in every 115 days. The low formed near 5529 levels were wave g was completed was also on our cycle and since then we can see that the commodity has shown a good rise.
In a nutshell, trend for Crude Oil remains positive. One can continue to use buy on dips approach to ride the trend and then we can expect prices to move upward towards 7100. While on the downside, 6500 can act as a near term support. Any breach below 6500 will be a sight of concern.
MCX Crude Daily chart Happened as on 5th September 2023

Happened: MCX crude oil was trading near 6868 levels when we published it. Prices took support precisely near 6500 levels and bounced back from it and achieved our target of 7100 and made high of 7121. For now, one can continue to ride the trend buy using buy on dips approach.
In short, the above analysis clearly shows how well the cycle theory works. We have been using these techniques by combining it with Neo wave and simple price action!!!
Master of Wave (MOW) – Elliott wave, Neo wave, Gann sq of 9 and Hurst’s Time cycles are the best advanced concepts of Technical analysis that I have ever used. Ensure to learn this science of trading in online event scheduled on 16th – 17th September 2023. Pre session videos, 5 Bonus videos for lifetime, 6 hours of Elliott wave videos for 1 months, Gann special video access will be given in addition to the actual live training. Limited seats only, Bonuses valid only for limited time. Fill below form for more details: