MCX Silver Shooting like a Rocket, Channels, Wave Pattern, MACD at its best
Jul 22, 2020MCX Silver has been in lime light since three days forming higher high and higher lows. It’s experiencing no looking back and moving one side direction.
Well, it was not a surprise for us. Our broader term view on this precious metal was near 56k and it has gone higher way beyond.
We were able to forecast the up move using Elliott wave, MACD the momentum indicator, Parabolic SAR, channels etc. See below the monthly research which consists the reason behind the up move.
Look below the chart and detailed research on MCX Silver taken from our Monthly research report – “The Financial Waves Monthly update”
MCX Silver continuous Daily chart (Anticipated as on)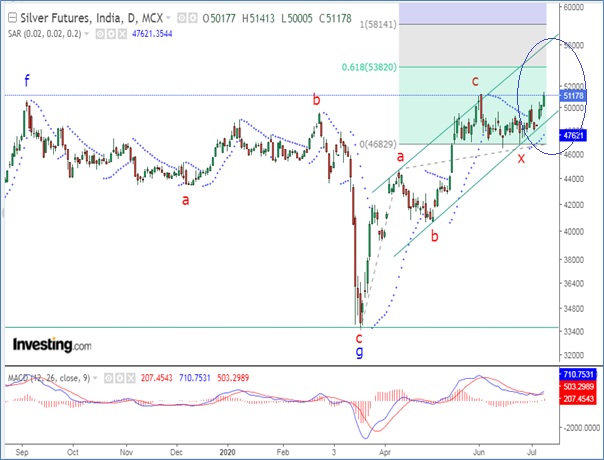
MCX Silver continuous Daily chart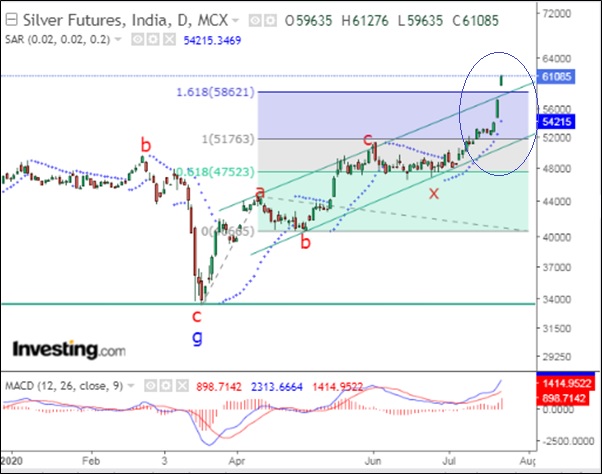
(Below is the extract of research from the Monthly report published in “The Financial Waves Monthly update”)
Elliott wave Analysis:
Price moved in the form of Diametric pattern since mid of 2012, which is a seven legged corrective pattern. This diametric pattern got completed near 33580 levels with completion of wave g.
Wave g was retraced in faster time which indicates that most probably the next leg on the upside has begun. But we are not yet ruling out the possibility that the rise is only wave x which we have shown on the daily chart. The internal counts suggest that wave x is forming a complex correction and the second set of up move has just begun. The rise can be seen well within the channel and the upper trendline resistance is placed near 56000 levels.
MACD & Parabolic SAR -The MACD indicator is a momentum indicator based on the difference of the 12 and 26 EMA. The MACD line crossing above the signal line indicates rising momentum. We can see on the daily chart MACD recently crossed the signal line on the upside and both are already above the zero line. The PSAR works best when the market is trending. The MACD has now confirmed that bullish momentum has just ignited and the PSAR has already moved below price and it could not be a better opportunity to go long using the PSAR as a trailing stop loss.
In short, for Silver the uptrend has already begun and one can use any dips to enter long positions and use the daily PSAR as a trailing stop loss currently near 48000 levels for a move towards 56000 or higher levels over the medium term. Move below 48000 – 47000 will result into an abrupt completion of the ongoing up move and increase the odds that the rise was only temporary pullback.
Happened: MCX Silver has been witnessing rocket like upward strong momentum. We have forecasted a month ago target of 56000 when prices were trading near
51170 levels. This long term view was as per the wave pattern and basic channelling pattern. Currently it has reached a peak near 61280 levels.
Subscribe to The Financial Waves Monthly Update which covers research on Global Equity Markets, Commodities, Currencies providing medium term outlook for the same. For more information Visit here
You can subscribe to the Intraday / Positional calls on commodity via SMS, WhatsApp and get detailed research along with it explaining the clear technical picture. Subscribe Here
Equip yourself with tools, indicators, methods that are necessary for trading in our BECOME MARKET WIZARD which has two modules MOTA and MOW. I will be explaining in much detail the on-going scenario in the first module online session of Master of Technical analysis (MOTA) scheduled in two days. Know more here