
Most Traders Ignore This Powerful Indicator. Are You One of Them Too?
Aug 06, 2026
Simple price action combined with Volume analysis and KST indicator can provide clear guidance for trading in stocks over short to medium term.
AUBANK Daily chart with Volume Profile & KST indicator
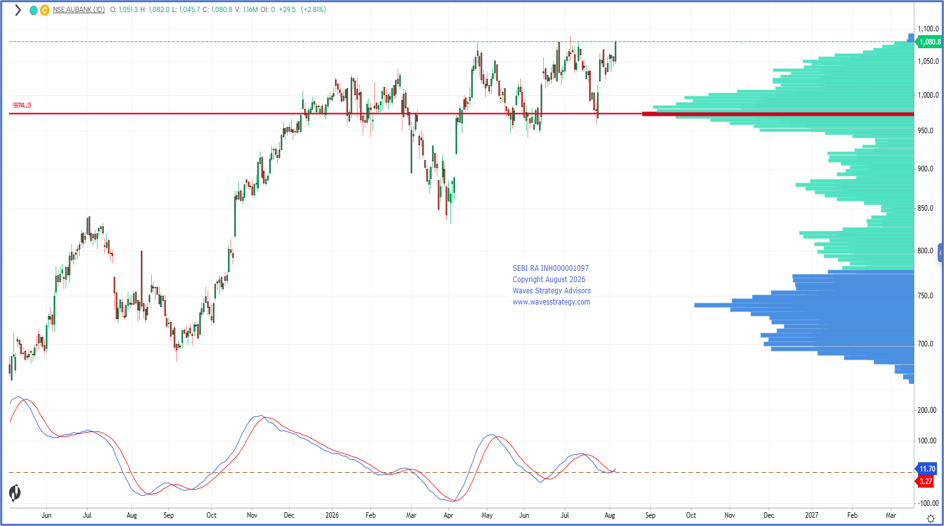
Volume Profile & Price Action
- Combining Volume Profile with basic Price Action significantly improves trading accuracy.
- This approach is beneficial for all traders, whether they are beginners or experienced market participants.
- Before applying this, it is essential to understand both tools individually. As proper understanding of these concepts helps traders interpret market behaviour more effectively.
Understanding Volume Profile
- Volume Profile is an advanced analytical tool that displays the price levels where significant trading activity has occurred.
- It helps traders identify areas of high and low market participation based on traded volume.
- It represents the price level with the highest traded volume.
- It acts as a magnet level, where the price tends to revisit frequently.
- Identify strong support and resistance zones.
- Improve entry and exit precision.
- Understand where institutional participation is concentrated.
Understanding KST indicator
- The KST (Know Sure Thing) Indicator is a momentum-based indicator.
- It helps traders assess the overall strength and direction of price movement.
Key signals:
- When the KST line crosses above the Signal line → Early sign of bullish momentum
- When it moves above the zero line → Confirms strengthening bullish momentum
- It is particularly useful for identifying trend shifts and momentum confirmation.
Application on AUBANK
- Recently, stock tested POC level on 23rd July near 962 levels and reversed sharply on the upside indicates positive sign and also highlights reliability of POC level which acted as a strong support level. Also, KST Line crossed signal line from below and comfortably trading above zero line indicates bullish momentum in the stock is expected to buildup.
Final Trading Outlook:
- Price action, and indicator alignment point towards a strong setup. The bullish setup is further supported by the KST indicator. For now, a break above prior swing high near 1091 level can push prices higher towards 1180 or higher with key support being around minor swing low of 1020 level.
Brahmastra Mentorship – Learn the Science of Timing the Market
Master the practical application of Elliott Wave, Neo Wave, Time Cycles, market timing, stock selection, risk management, and professional trading strategies through our comprehensive three-month Brahmastra Mentorship Program.
Fill in the form below to receive complete program details.