Muthoot Fin: Following the path directed by Impulse Wave, Channels, Bollinger Band
Jul 21, 2020Muthoot Finance has exhibited a pattern which looks like a text book example of Impulse Elliott wave pattern.
Elliott wave is a classical technique that can help in forecasting of prices and provides very high accuracy if applied correctly. See the application of Bollinger Bands, Elliott wave and Channels in below research
Look at the below chart of Muthoot Finance published in the equity research report on 13th July 2020 morning before markets opened – “The Financial Waves short term update”
Muthoot Finance 60 mins chart: (Anticipated as on 13th July 2020)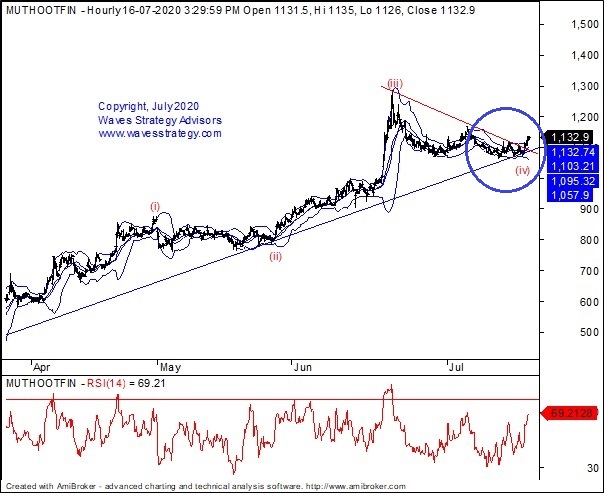
Muthoot Finance 60 mins chart: (Happened on 21st July 2020)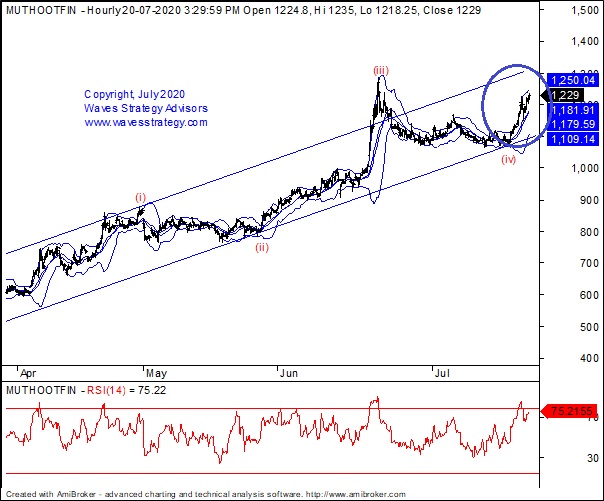
Wave analysis:
On the daily chart, the stock is moving in the form of impulse wave pattern. The strongest and longest wave i.e. wave 3 is in progress. Also bounce back is seen from the channel support. Wave (v) is in progress on upside.
On the hourly chart, as per the wave counts the internal count of wave 3 tells that wave (iv) has been terminated near channel support and currently wave (v) is in progress on upside. Since prices are place near the upper Bollinger band which suggests positive bias. As long as middle Bollinger band is intact we continue to see the up move.
In nutshell, Muthoot Finance seems to be sideways to positive. Break above 1150 levels will prices higher towards 1200 levels as long as 1090 stays protected on lower side.
Happened: Muthoot Finance precisely moved as expected and as per direction of wave counts which pointed on upside in the form of wave (v). Prices have moved beyond our target level near 1250 levels. Positive Bias was made with the help of Bollinger band.
We cannot be more accurate than this. The above research shows how well Elliott waves work and how different tools could help in deriving the exact entry points and targets for the same. Get access to the daily equity research report & capture good trading opportunity over short term “The Financial Waves short term update”- Get access here
Register for our Intraday/positional Nifty, Bank Nifty and Equity, Commodity, Currency calls service and trade precisely. Register here
Get strategies which could be applied across all segments in the upcoming ONLINE training scheduled on 25th &26th July in Master of Technical analysis (MOTA). Also learn about Neo wave, Elliott wave, Time cycles scheduled on 22nd and 23rd August (MOW). You do not necessarily require prior knowledge of technical analysis and we will ensure you get it right from the very basic to most advanced level. Dedicated discussion groups will be created to keep the learning going in future. Only 4 days to go for MOTA Hurry up and Grab your seats Know more here