Netweb Near All-Time High: Fresh Breakout Loading?
May 06, 2026
Combining Elliott Wave Theory with price action helps traders identify high-probability setups.
Beginners chase small moves, while experienced traders focus on capturing the strongest part of the trend. By aligning wave structure with real-time price action, traders filter market noise and trade with greater confidence.
Netweb Daily chart as on 06th May 2026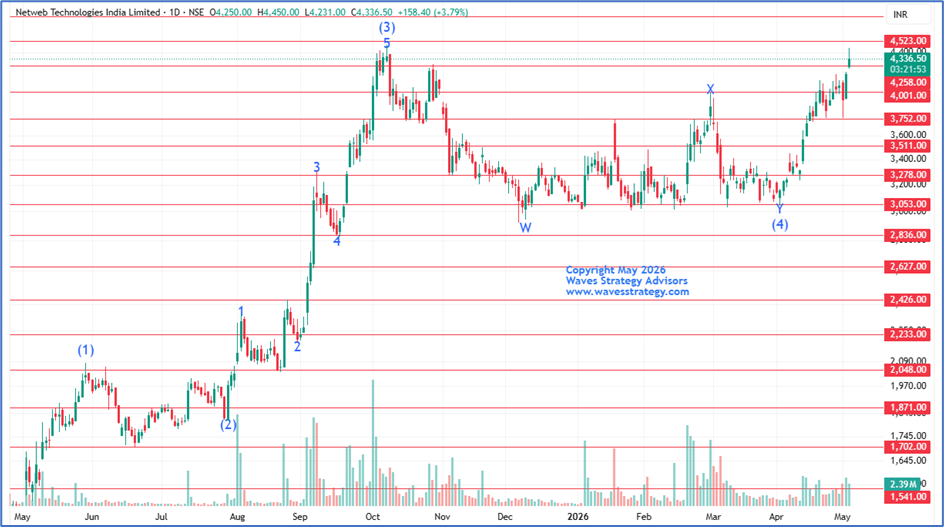
NETWEB – Elliott Wave Analysis
- The rally since July 2025 is in form of primary wave (3) which got completed near the top made in October 2025 where we saw formation of new all-time high near 4479
- Recently primary wave (4) got completed near the 3043 level in form of a complex corrective pattern (W-X-Y) and now the wave (5) has begun indicating a new phase of buying has emerged.
- As per guidelines wave (5) often retraces like wave (1).
Gann square of 9
- The horizontal lines on the chart indicate key levels derived from the Gann Square of 9, which have consistently acted as important support and resistance zones.
- Recently, prices have decisively broken above the 4258 Gann level and continue to trade higher, aligning with our expectations.
- As long as the key Gann support near 3752 remains intact, the possibility of an upward move towards the next Gann resistance around 4523 stays open.
In a nutshell
- Combining Elliott Wave Theory with Gann Square of 9 levels can help traders forecast potential price movements with greater precision by identifying key support, resistance, entry, and exit zones.
- The overall trend in Netweb remains bullish, with the stock currently moving towards the next major Gann resistance near the 4523 level.
- Traders can consider using dips as buying opportunities to participate in the ongoing uptrend, while keeping the 3752 Gann level as an important support on the downside.
Brahmastra: Go Beyond Price – Learn Time Cycles
Brahmastra is a 3-month intensive journey focused on:
- Time Cycle Analysis
- Combining Time + Elliott Wave
- Precision in identifying turning points to the day
Includes
- Tradership sessions
- Full access to Trishul Program
- Structured trader development approach
This program is built on a powerful belief:
Markets can be timed—not just analyzed.
👉 For more details, click here
Trishul Program: Master the Three Pillars of Market Understanding
Trishul is designed as a structured learning pathway combining three powerful frameworks:
- Options Mantra (Online Videos)
- Elliott Wave (Foundation to Advanced)
- NeoWave (Advanced Forecasting tool & Precision)
What You Learn
- Event-driven options strategies
- Expiry-day income frameworks
- Risk-reward based trade construction
- Tools like Keltner Channels & KST
- Practical stop-loss & execution discipline
This is not theory—it is applied market understanding.
👉 Limited seats only. Fill the form below to apply.