Nifty : 2 powerful indicators for trend following
Jun 06, 2022
Like this Article? Share it with your friends!
Nifty Elliott Wave – Neo wave pattern has continued to show amazing outcome with prices moving in tandem with the wave patterns. The wave structure is helping us forecast each and every move and below charts clearly shows that.
Nifty Hourly Chart:
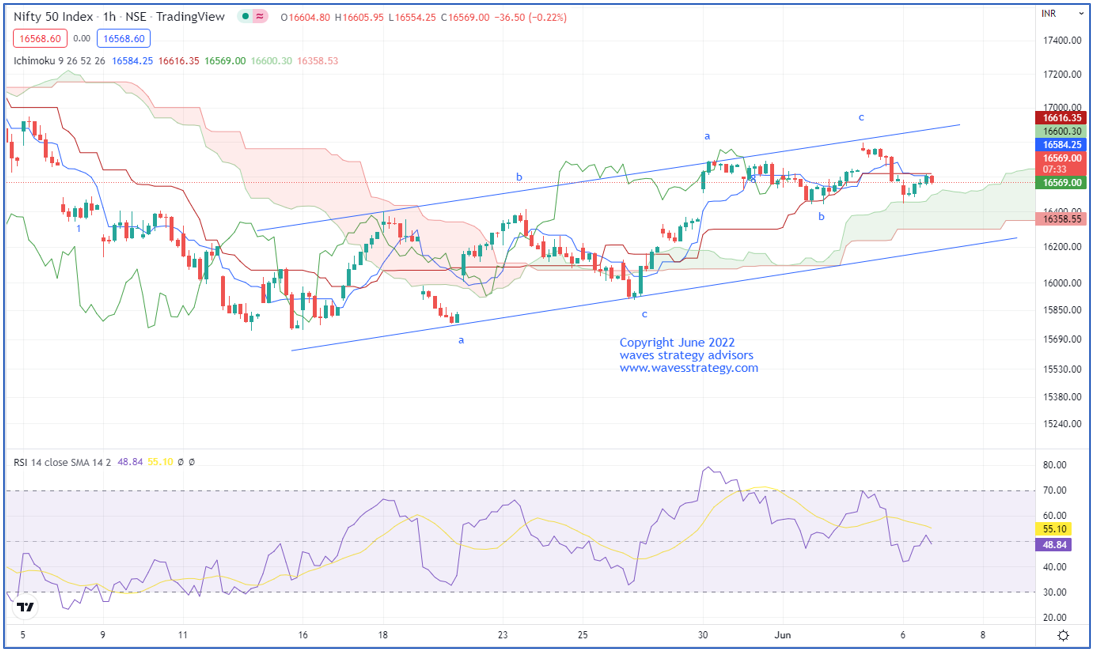
On the 60 mins chart, we can see that prices are moving well within the upward sloping channel. Also, the move towards the channel resistance which is near 16800 was wave c unfolding and another leg has started on the downside. However, if we see a faster retracement of wave c then the down move can be wave x. Also, we formed a higher high on the Nifty index, and the ‘RSI indicators’ formed a lower high indicating a negative divergence. This divergence after the recent rally of 1000 points indicates limited upside for the time being, and hence we could see the market resuming its corrective phase.
In a nutshell, Nifty has still not given a daily close below the previous day low. For the positive movement to continue, the break above 16700 is required for a move towards 16800 followed by 16900 levels. whereas any move below 16420 will be the first sign of weakness.
Mentorship on Timing the markets – Learn the science of Timing the market over more than 3 months with lifelong association, live trading sessions, Algo creation and everything focusing on Time trading. Fill below form for more details.