Nifty 55 Days Time Cycle, Neo wave Why 17166 is Crucial?
Sep 19, 2022
Like this Article? Share it with your friends!
Time Cycles along with advanced Elliott wave / Neo wave is powerful way to forecast and trade the markets if one wants to catch reversals.
We have been using 55 Days Time Cycle for almost a decade to identify key areas of reversal and have succeeded to catch the top made at 18600, later at 18350, another at 18095 and this time again it seems we might be topping out.
Nifty 55 Days Time cycle with Neo wave Daily chart:
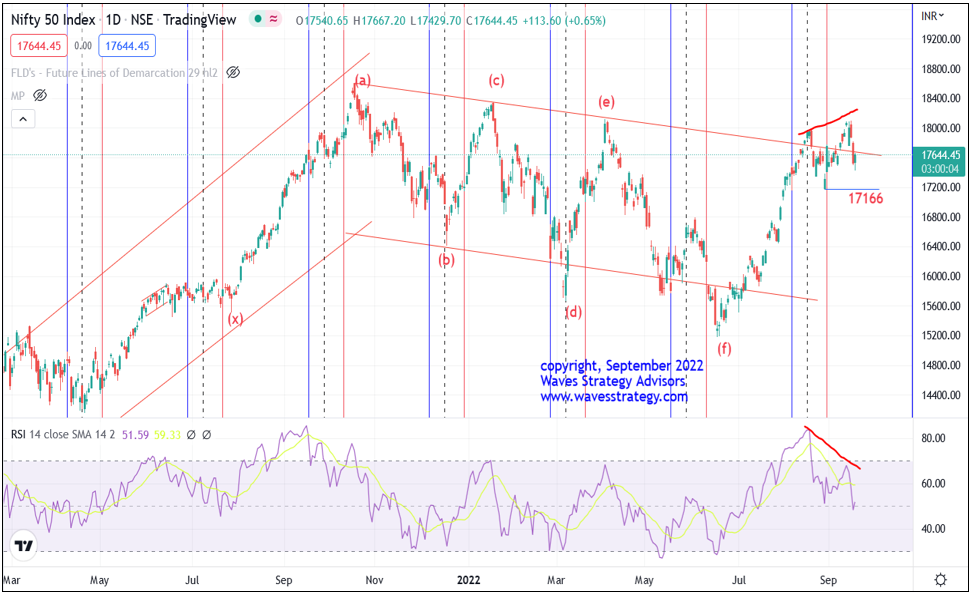
In above chart we can see that prices have been moving in form of Diametric pattern which is a 7 legged corrective pattern. Current up move looks to be wave (g). We are already seeing negative divergence between prices and RSI on daily time frame along with double top formation. The neckline of this pattern is near 17166 which is also important from Time cycle perspective.
55 Days Time Cycle – This cycle has been working extremely well in capturing the lows as we can see in the above chart. The middle black vertical line is where majority of the lows are formed whereas we can also see on a few occasions the blue and the red vertical lines where the lows are formed. So we have a time zone between which we expect prices to form a low.
The latest Time cycle suggests that prices formed a low near the red vertical time cycle with low of prices near 17166. Break below this level will indicate that the top is in place and will not be taken out until 4th of November 2022 which is the next 55 days cycle low.
In a nutshell, 17166 holds the key. Break below this can result into sudden and sharp reversal on downside with probably a crash towards 15600 and lower. Thus by using pattern, Neo wave and Time cycles one can trade with very high conviction and confidence. On upside, 18100 is key resistance. Any move above this will indicate the fall is only going to be delayed by trapping more Bulls.
Equity research report – Get access to daily equity research report “The Financial Waves Short term update” and see yourself complete chart with detailed research along with stocks exhibiting trading opportunity. Subscribe annually and get monthly research free along with it. Access it here
Mentorship on Timing the market – More than 3 months of Mentorship focusses on simple yet powerful trading tools that can change the very way you are seeing the market. It will cover right from basics to the advanced concepts of technical analysis including Elliott wave, Neo wave and Time cycles for timing the market to the very day, hour and minute. Check here for more details.