Nifty Time Trading Using 15 Minutes chart
Oct 12, 2022
Like this Article? Share it with your friends!
Nifty has been moving as per the rhythm of Time extremely well. We use Time cycles in order to identify buying or selling opportunity along with the date and time when the reversal is expected.
Below chart of Nifty shows the path that was derived along with 1000’s of participants who were part of live session on 8th October 2022.
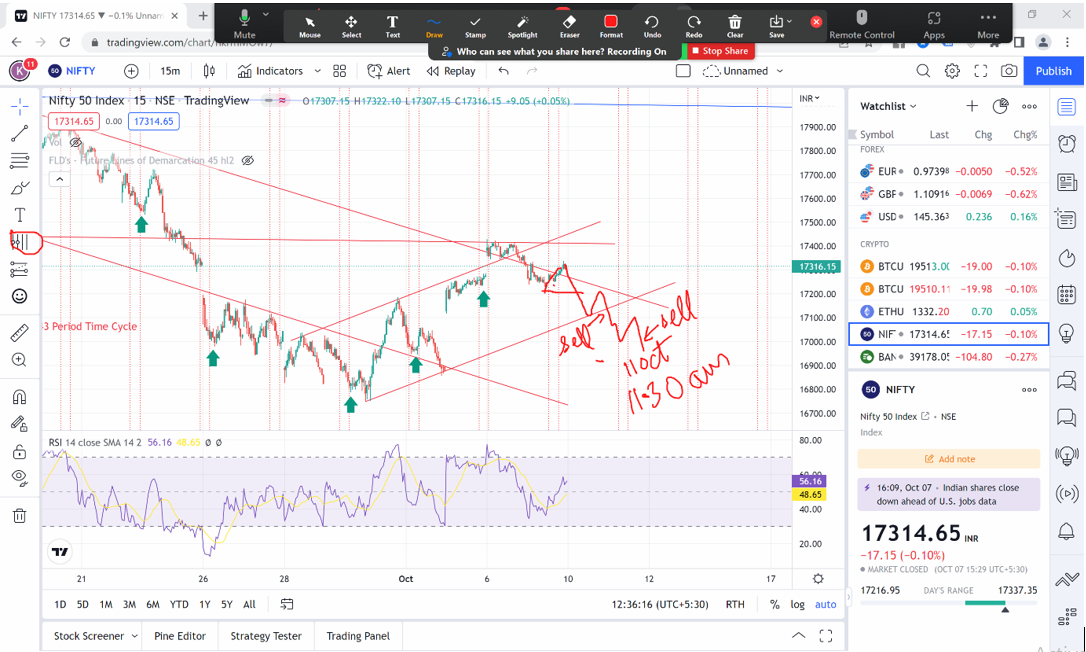
Nifty 15 minutes chart: (Anticipated during Live webinar) 8th October 2022
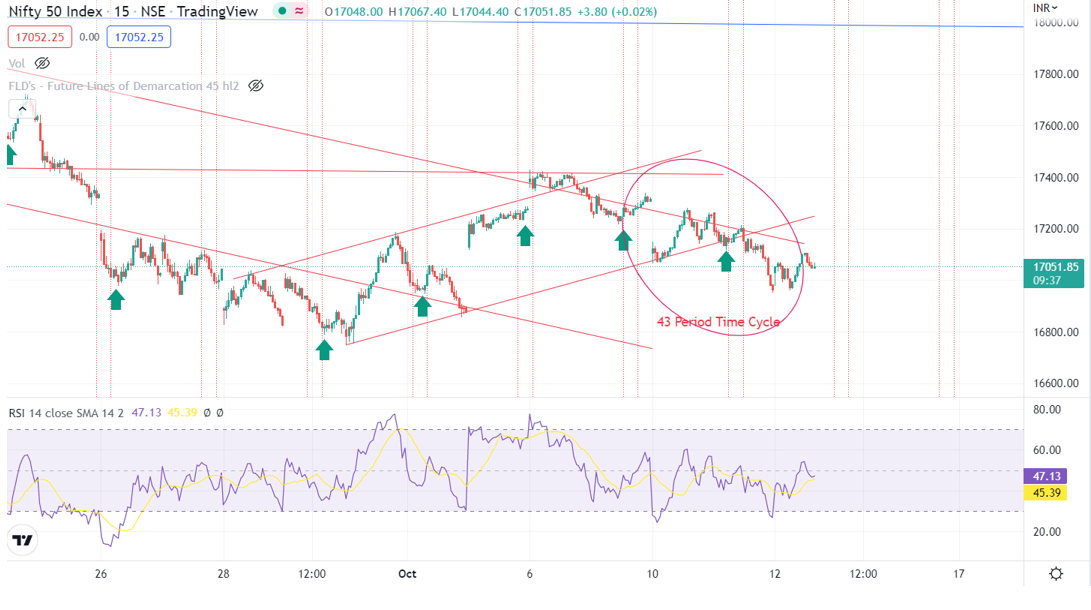
Nifty happened as on 11th October 2022
As shown on first chart we can see the probable path in terms of Time prices can follow. Also it was mentioned that the pullback will be shallow and it will provide opportunity to sell as the bigger cycle is on downside. The Date and Time mentioned was 11th October, 11.30am.
Happened: Nifty moved as per the path, formed a minor low with pullback on 11th October but a little early near 10.30am and then gave away sharply on the downside. Time is dynamic and so we have a zone of around an hour for reversal. Prices reversed exactly within the expected zone and for Option Traders this is very vital information.
There is a method by which one can even derive price targets using Time and it is simple.
Gann square of 9 level is at 17227 and it is acting like magnet attracting prices again and again towards it. By combining Gann square of 9 method along with Time cycles on daily, 15 minutes chart one can form very prudent risk reward trade setups even on stocks, Bank Nifty.
Master of Cycles (MOC) – is scheduled on 15th & 16th October 2022, where we will discuss clear trade setups using Hurst’s Time cycles, Gann square of 9 and derive trades on Options forming strategies. 3 days to go, Limited seats, For more details fill the form below